Correlation Coefficient Indicator for MetaTrader 5 | Download FREE
$0.00
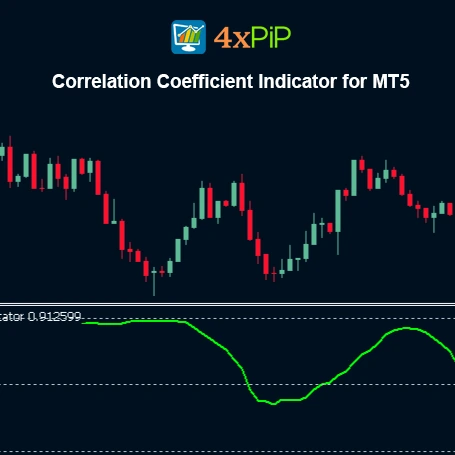
The Correlation Coefficient Indicator for MetaTrader 5 measures how closely two financial instruments move in relation to each other. It calculates and displays the correlation coefficient (CC) between the chart symbol and a selected secondary symbol. Traders use this tool to identify positive or negative relationships between pairs like EURUSD and USDCAD. It helps detect whether instruments move together, in opposite directions, or independently.
Description
What is the Correlation Coefficient Indicator?
The Correlation Coefficient Indicator (CC) is a statistical tool designed for traders who want to understand the relationship between two markets. It quantifies how synchronously two instruments move, on a scale from +1 to -1.
- A +1 value shows a perfect positive correlation, both instruments move in the same direction.
- A -1 value shows a perfect negative correlation, they move in opposite directions.
- A 0 value means there is no correlation, their price movements are unrelated.
How Does It Work in MetaTrader 5?
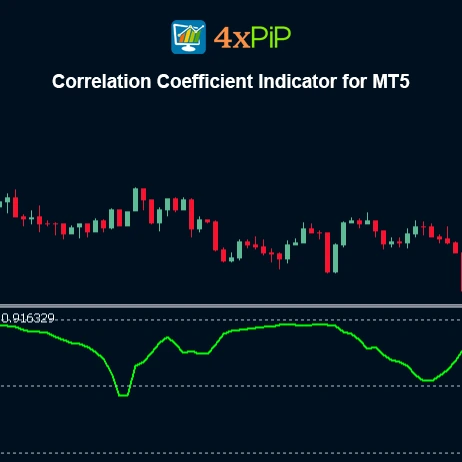
When added to a chart, the indicator compares the price data of the current symbol (for example, EURUSD) with the selected secondary symbol (for example, USDCAD). The indicator continuously calculates the correlation coefficient over a defined number of bars using the selected price source (Close, Open, High, Low). It then plots the correlation as a line that oscillates between -1 and +1, showing changes in the strength and direction of the relationship between both instruments.
Why Is It Useful for Traders?
Traders use the correlation coefficient to find pairs that behave similarly or move inversely. This helps in identifying hedging opportunities, reducing duplicate exposure, and improving portfolio diversification.
For example, a trader can avoid opening two positions that move identically, or they can pair trades that move oppositely to balance risk. The indicator also helps spot correlation shifts, showing when market relationships are strengthening or weakening.
Advantages
- Identifies relationships between two trading instruments.
- Helps detect positive and negative correlations.
- Supports better risk and portfolio management.
- Prevents overexposure to correlated assets.
- Highlights diversification opportunities.
- Detects changing market relationships in real time.
- Works for any instrument on MetaTrader 5.
- Simple to use and interpret on the chart.
- Assists in building effective hedging strategies.
- Supports decision-making for long-term investors and day traders alike.
Features
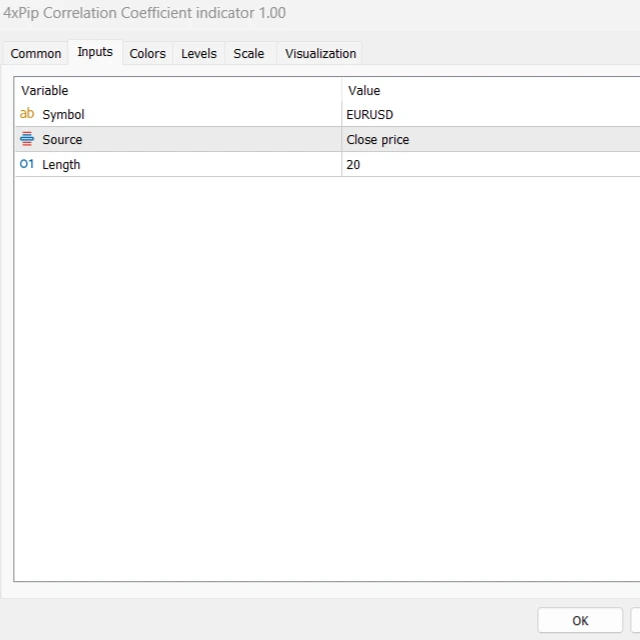
- Customizable second symbol: select any instrument for correlation comparison.
- Adjustable calculation period (Length): set the number of bars for correlation analysis.
- Selectable price source: choose Open, Close, High, Low, or Median prices.
- Dynamic line display: real-time correlation line plotted between +1 and -1.
- Cross-symbol analysis: works with all Forex pairs, indices, commodities, or crypto.
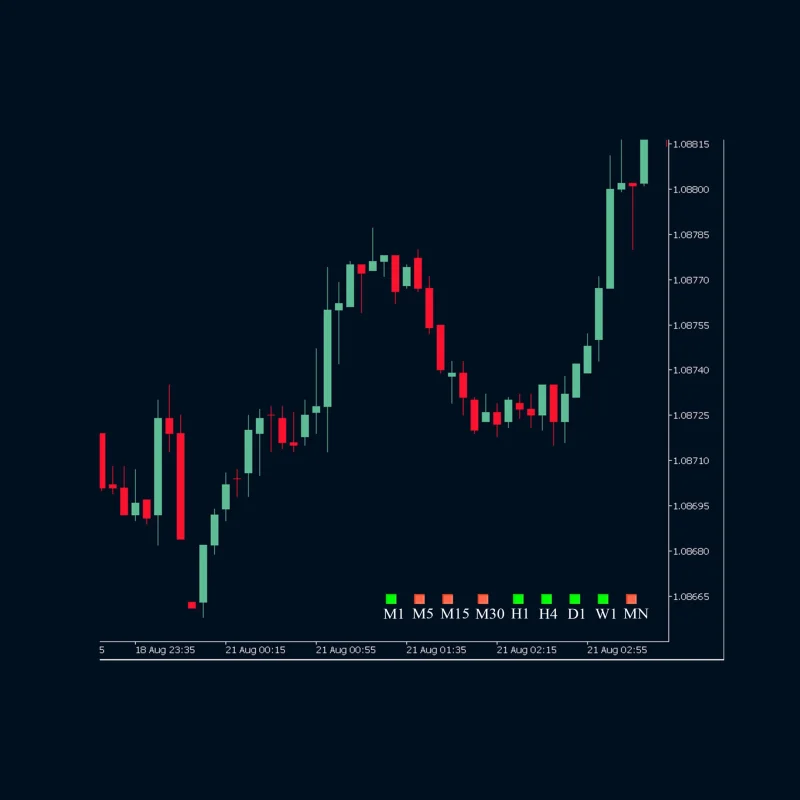
- Compatible with all timeframes: from M1 to MN.
- Lightweight design: minimal CPU usage for smooth performance.
- Instant updates: recalculates automatically with every new tick.
- Overlay visualization: visually compare symbol relationships on chart.
- Fully free to download and use: no hidden limitations.
How to Trade
To implement the Correlation Coefficient Indicator, traders can monitor the correlation line between their chosen pair (e.g., EURUSD vs. USDCAD) to identify when the relationship strengthens or weakens. A correlation near +1 suggests both move together; it is ideal for avoiding duplicate trades, while a value near -1 indicates an inverse relationship, useful for hedging or balancing exposure.
When the correlation shifts significantly, it signals potential market changes. Traders can reduce risk by closing correlated positions or opening offsetting ones when inverse relationships appear. Combining this indicator with technical setups or trend analysis enhances decision-making and portfolio diversification.
Formula:
Correlation = cov(X,Y)XY
Conclusion
The Correlation Coefficient Indicator for MetaTrader 5 is a simple yet powerful tool for identifying relationships between trading instruments. By showing how two markets move together or apart, it helps traders manage risk, avoid duplicated exposure, and maintain balanced portfolios. Its customizable parameters and clear visual output make it a practical addition for every trader who values data-driven decision-making. Download the Correlation Coefficient Indicator for MT5 today and start monitoring correlations with precision and confidence.
DOWNLOAD NOW Reach Us on WhatsApp
 Fly Over to Telegram
 Drop Us an Email

Reviews
There are no reviews yet