Wick Engulf Indicator for MetaTrader 5 – Download FREE
$0.00
This indicator identifies Engulfing Candlestick Patterns. It analyzes engulfing patterns based on the relationship between the open, high, low, and close prices of two consecutive candles. It identifies wick engulfing patterns in the market and allows traders to decide according to the pattern.
Description
What is Wick Engulfing Candlestick Pattern? Engulfing patterns are two-candle reversal signals used in technical analysis to identify potential trend changes in price movements. They consist of a smaller-bodied candle followed by a larger-bodied candle that completely “engulfs” the body and wicks (high and low extremes) of the first candle. There are two main types of engulfing patterns
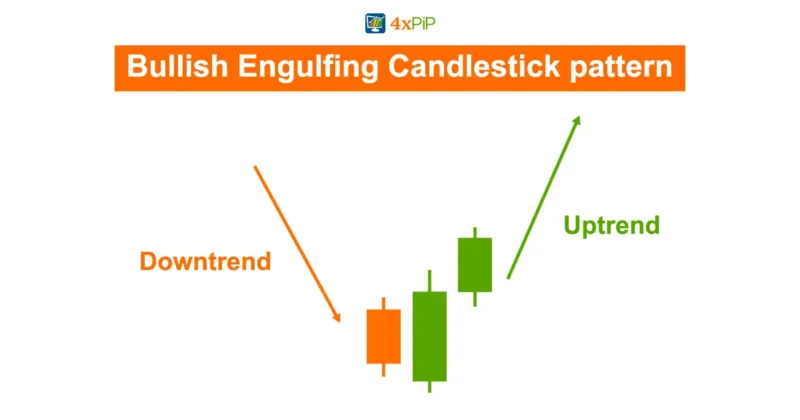
Bullish Engulfing:
This pattern usually shows up when a downward trend in the market is ending. It involves two candles: the first one is small and often black or red, showing a negative feeling.
Then, a second candle appears with a bigger body, usually white or green, indicating a positive change. What makes this pattern special is second candle completely covering first one, including body and sticks. Also, with the sticks of the second candle going beyond those of the first. This covering of the first candle by the second one suggests a big change in how people feel about the market. It means that buyers are taking over, beating the sellers, and pushing prices up during the trading time.
Bearish Engulfing:
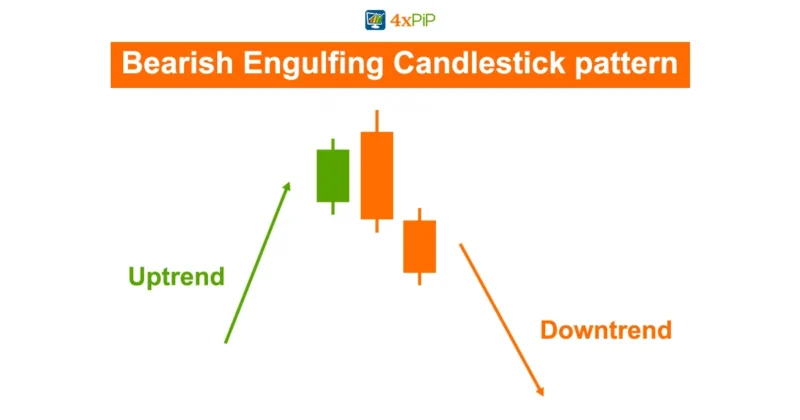
This pattern happens when a rising trend in the market is about to end. There are two candles involved, each showing important information about how the market feels and where prices might go next. The first candle is small and usually white or green, which means people are feeling positive about the market.
Then comes the second candle, which is bigger and often black or red, showing that the sentiment is turning negative. Importantly, the second candle starts higher than where the first one ended, showing a price jump. The body of the second candle completely covers the first one, and its wicks stick out further. This whole situation suggests that the market might be changing from going up to going down. It’s like the bears are taking control from the bulls, pushing prices down.
Important points to consider:
Engulfing patterns are strong signals in trading. They show up after a long trend, either going up or down and happen with a lot of trading activity on the second candle. This combination makes the engulfing pattern very reliable and important because it suggests the market might change direction. But if you see an engulfing pattern all by itself, especially with low trading activity, it might not be trustworthy. Without a lot of trading activity, the pattern might not mean much and could lead to bad decisions for traders.
To make sure they’re making the right choice, traders often look for confirmation from other indicators, like the Relative Strength Index (RSI) or Moving Average Convergence Divergence (MACD). These indicators give more information about what’s happening in the market and can back up the signal from the engulfing pattern. When these indicators match up with the engulfing pattern, showing that the market is either overbought or oversold, it makes the reversal signal stronger. By using several indicators together, traders can be more confident in their decisions and better handle changes in the market.
Formula:
Open1 = Open price of previous candle
Close1 = Close price of previous candle
Open2 = Open price of candle before previous candle
Close2 = Close price of candle before previous candle
Bullish Engulfing: Open2 > Close2 and Open1 < Close1 and Open1 < Close2 and Close1 > Open2
How to Trade with Wick Engulf indicator?
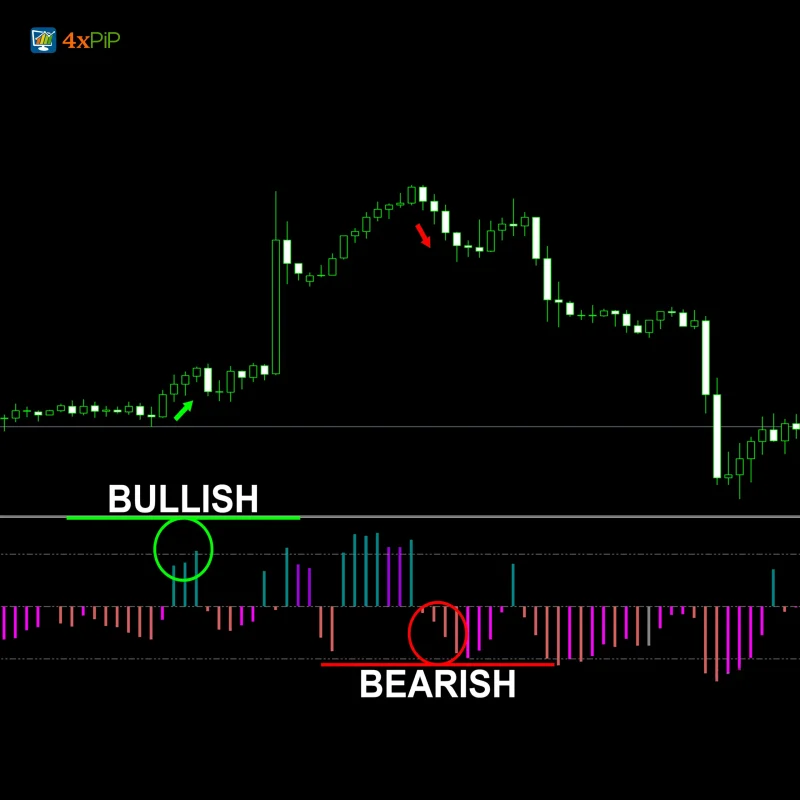
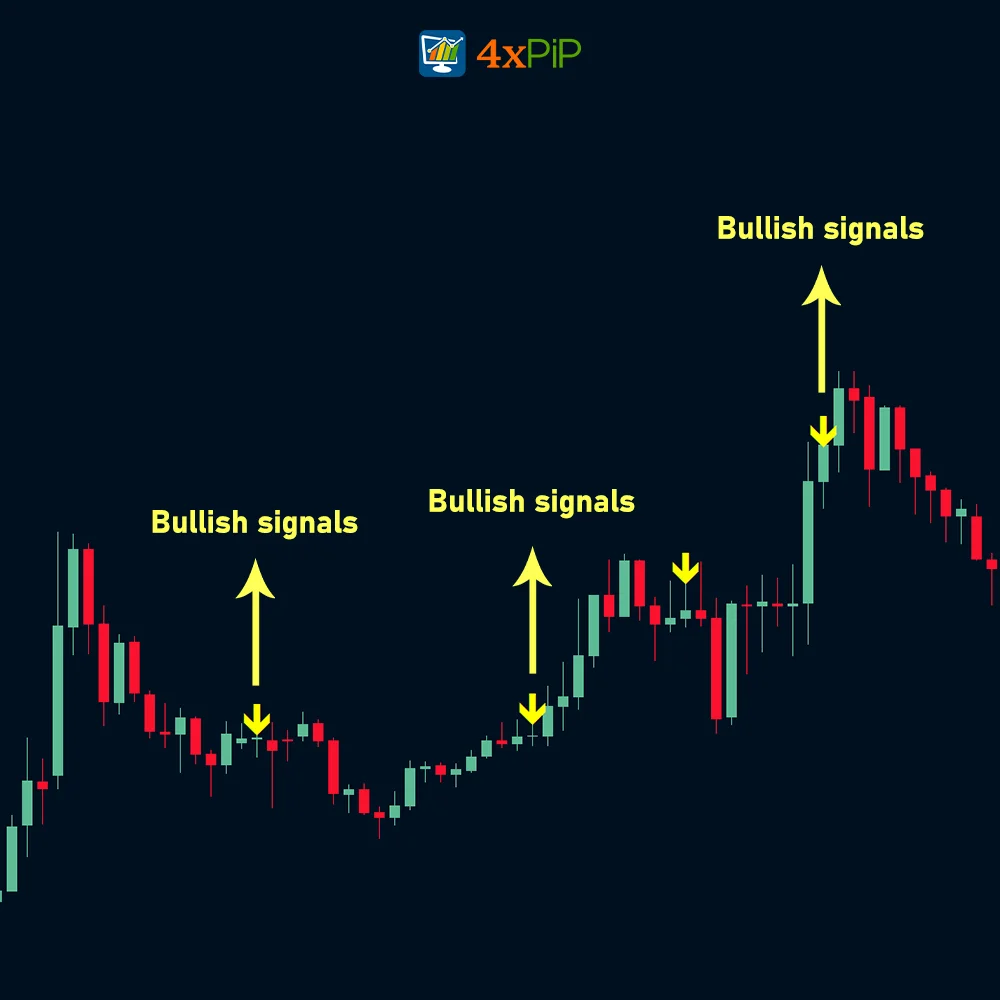
The indicator plots an upward arrow, indicating a bullish engulfing pattern and it plots a downward arrow, indicating a bearish engulfing pattern. For long, place a stop-loss order below the low of the bearish candle preceding the bullish engulfing pattern. For Short, place a stop-loss order above the high of the bullish candle preceding the bearish engulfing pattern.
There are several options for take-profit:
Set a fixed profit target based on your risk-reward ratio, set take-profit based on the Average True Range (ATR) indicator, or Implement a trailing stop-loss that automatically adjusts as the price moves in your favor.
Consider using additional technical indicators like RSI or MACD to confirm the engulfing pattern’s strength and potential reversal signal. Proper risk management is crucial. Only risk a small percentage of your capital per trade (e.g., 1-2%). Engulfing patterns might be more reliable during trending markets compared to choppy or range-bound markets. Before deploying any strategy with real capital, backtest it on historical data to assess its performance and identify potential weaknesses.
Features:
Here are some features of by this indicator:
- Trend Reversal Signal: Engulfing patterns are primarily used to identify potential trend reversals. A bullish engulfing pattern suggests a potential shift from a downtrend to an uptrend, while a bearish engulfing pattern suggests a potential shift from an uptrend to a downtrend.
- Two-Candle Pattern: It consists of two consecutive candlesticks.
- Engulfing Body: The second candle’s body completely engulfs the first candle’s body.
- Wick Coverage: The second candle’s wicks (high and low extremes) extend beyond the first candle’s wicks, further emphasizing the engulfing effect.
- Open Price Gap: In strong engulfing patterns, the second candle might open with a gap (up for bullish, down for bearish) compared to the first candle’s close, highlighting a stronger directional push.
- Volume Confirmation: The engulfing pattern’s significance is strengthened by high trading volume on the second engulfing candle. High volume suggests more conviction behind the price movement.
- Arrow Display: The provided code utilizes arrows to visually represent the engulfing patterns on the chart. Upward arrows indicate bullish engulfing, and downward arrows indicate bearish engulfing.
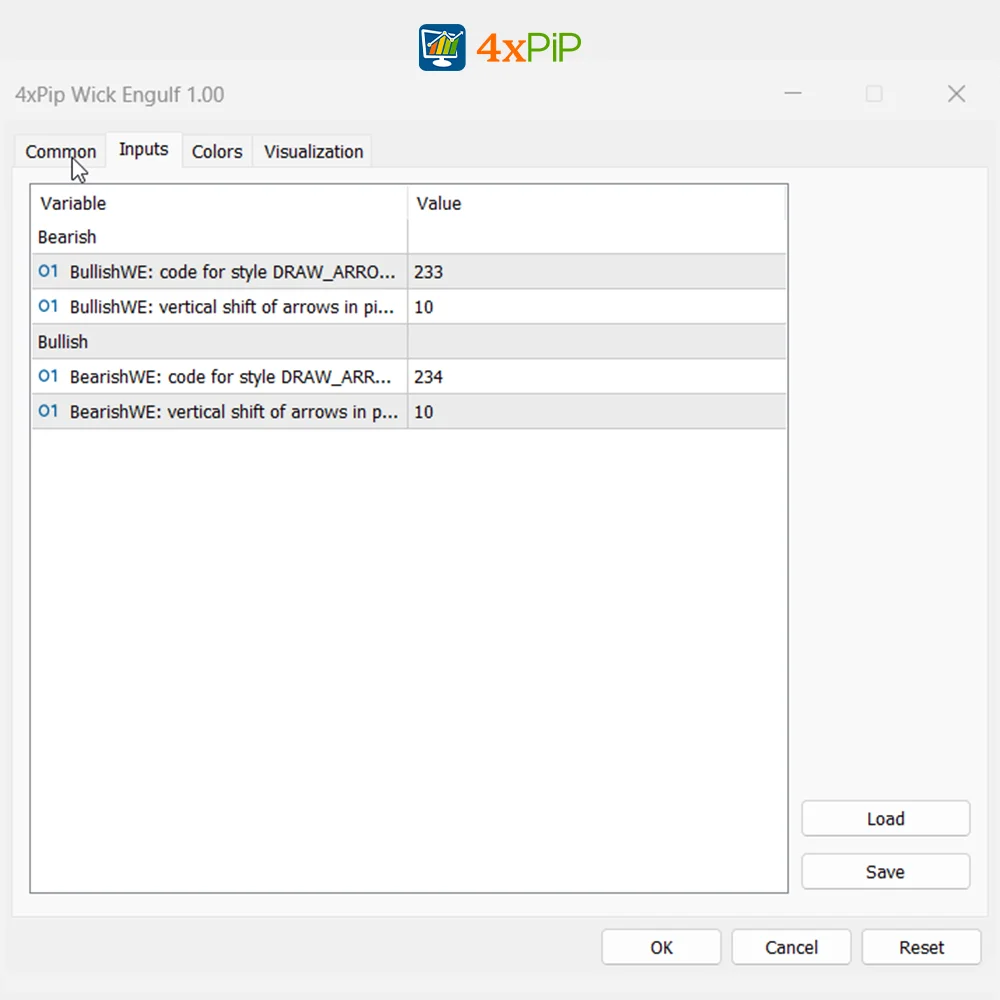
- Customization: The indicator offers some customization options, such as setting the vertical shift of the arrows displayed for the engulfing patterns.
Conclusion
The Wick Engulf indicator for MetaTrader 5 is a powerful tool designed to identify Engulfing Candlestick Patterns in the financial markets. These patterns, comprising two consecutive candles, indicate potential trend reversals. The indicator highlights bullish engulfing patterns, suggesting a shift from a downtrend to an uptrend, and bearish engulfing patterns, indicating a transition from an uptrend to a downtrend. By analyzing the relationship between open, high, low, and close prices, traders can make informed decisions based on the signals provided. The indicator offers various features such as trend reversal signals, two-candle pattern recognition, engulfing body and wick coverage analysis, open price gap identification, volume confirmation, arrow display for visual representation, and customization options for better user experience.
DOWNLOAD NOWSettings
- BullishWE: code for style DRAW_ARROW (font Wingdings)
- BullishWE: vertical shift of arrows in pixels
- BearishWE: code for style DRAW_ARROW (font Wingdings)
- BearishWE: vertical shift of arrows in pixels
21 reviews for Wick Engulf Indicator for MetaTrader 5 – Download FREE
| 5 star | 57 | 57% |
| 4 star | 42 | 42% |
| 3 star | 0% | |
| 2 star | 0% | |
| 1 star | 0% |
Sorry, no reviews match your current selections
Q & A
For long positions, stop-loss orders are typically placed below the low of the bearish candle preceding the bullish engulfing pattern. For short positions, stop-loss orders are placed above the high of the bullish candle preceding the bearish engulfing pattern.
Customer Support answered on April 22, 2024Traders often use indicators like the Relative Strength Index (RSI) or Moving Average Convergence Divergence (MACD) to confirm the strength of engulfing patterns and potential reversal signals.
Customer Support answered on April 22, 2024Traders consider engulfing patterns as strong signals in trading, particularly when they occur after a long trend with high trading activity. However, traders often seek confirmation from other indicators to enhance reliability.
Customer Support answered on April 22, 2024The Wick Engulf indicator identifies bullish and bearish engulfing patterns, providing traders with signals for potential trend reversals, thus assisting them in making informed trading decisions.
Customer Support answered on April 3, 2024An Engulfing Candlestick Pattern consists of two consecutive candles where the body of the second candle completely engulfs the body of the first candle, indicating a potential trend reversal.
Customer Support answered on April 3, 2024Sorry, no questions were found
Related products
-
 Free
FreeMT5 Indicator MTF bar detector
Rated 5.00 out of 5$0.00 Select options -
 Premium
Forex Scanner: Dashboard Scanner for MT5 | Market Scanner
Rated 5.00 out of 5$299.00Original price was: $299.00.$199.00Current price is: $199.00. Select options -
 Free
FreeAddition of Alerts to your EA indicator MT5
Rated 4.73 out of 5$30.00 Select options -
 Free
FreeMT5 MACD Explained Indicator
Rated 5.00 out of 5$0.00 Select options



 Reach Us on WhatsApp
 Fly Over to Telegram
 Drop Us an Email
Martingale EA is effective, but it’s not a foolproof strategy. The 100% winning rate claim is a bit ambitious. Use it cautiously, and it can be a valuable asset in your trading arsenal.
Martingale EA delivers as promised. The Takeprofit feature works like magic, and it adapts well to market conditions. My trading success has seen a noticeable boost since I started using it.
The EA is effective, but caution is key. The 100% winning rate claim might be a bit exaggerated. Nonetheless, it’s a valuable tool if used with a solid risk management plan.
Impressive EA with a solid strategy. The intelligent forex calculator is a game-changer. My drawdown issues have significantly reduced. Still, remember to use it wisely and manage your risks.
Martingale EA is a reliable performer. The 100% winning rate may not be guaranteed, but it significantly improves your trading odds. Use it wisely, and it can be a game-changer.