In the fast-paced world of trading, traders seeking to understand market trends and make informed trading decisions must master technical analysis. One powerful indicator for this purpose is the Exponential Moving Average (EMA). In this article, 4xPip delves into the concept of Exponential Moving Average in trading, its formula, calculation, and why it has become staple in trader’s toolbox. If you’re new to trading, consider seeking guidance from experts at 4xPip and exploring range of products and automated trading-robots. Recognized as a leading platform, 4xPip offers top-notch trading tools and valuable information.
What Is The Moving Average In Trading?
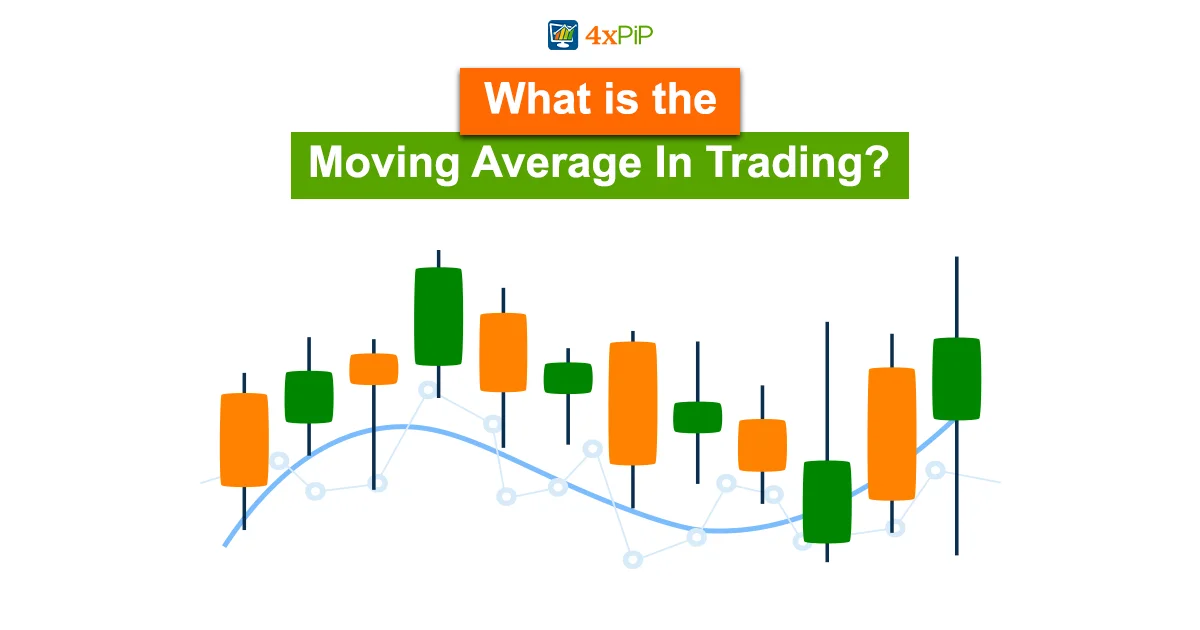
Moving Averages (MA) are fundamental indicators in technical analysis widely used by traders and analysts to gauge the direction and strength of trends in financial markets. Its purpose is to enhance the clarity of price data by continually updating the average price. An ascending moving average signals an uptrend in the security or currency, whereas a descending moving average suggests a downtrend in currency. These indicators help smooth out price data and clarify the underlying trend by filtering out short-term fluctuations. One of the most common moving averages in trading is the Simple Moving Average (SMA).
The 4xPip MT4 Optimized MA Indicator is a technical analysis tool crafted to assist traders in recognizing potential trends within the forex market. 4xPip has developed an optimized version of the moving average indicator to analyze the market trend accurately. The MT4 optimized indicator produces signals through crossovers, aiding traders in determining potential entry and exit points. This tool proves valuable in identifying both upward and downward trends in the market. You can download it from 4xPip.com.
Still, it has evolved to include more sophisticated variations, such as the Exponential Moving Average (EMA) and the Weighted Moving Average (WMA). Let’s explore the concept of Exponential Moving Average (EMA).
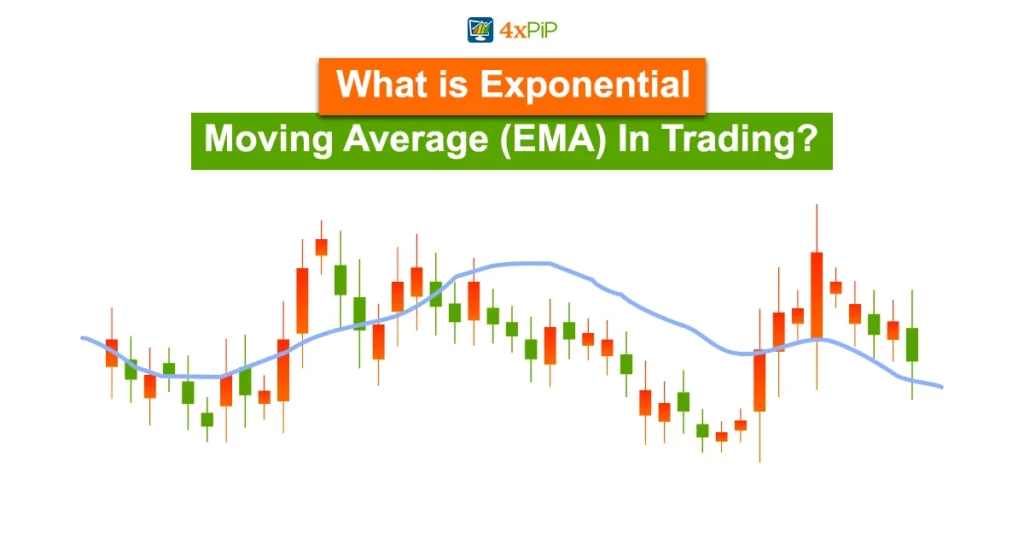
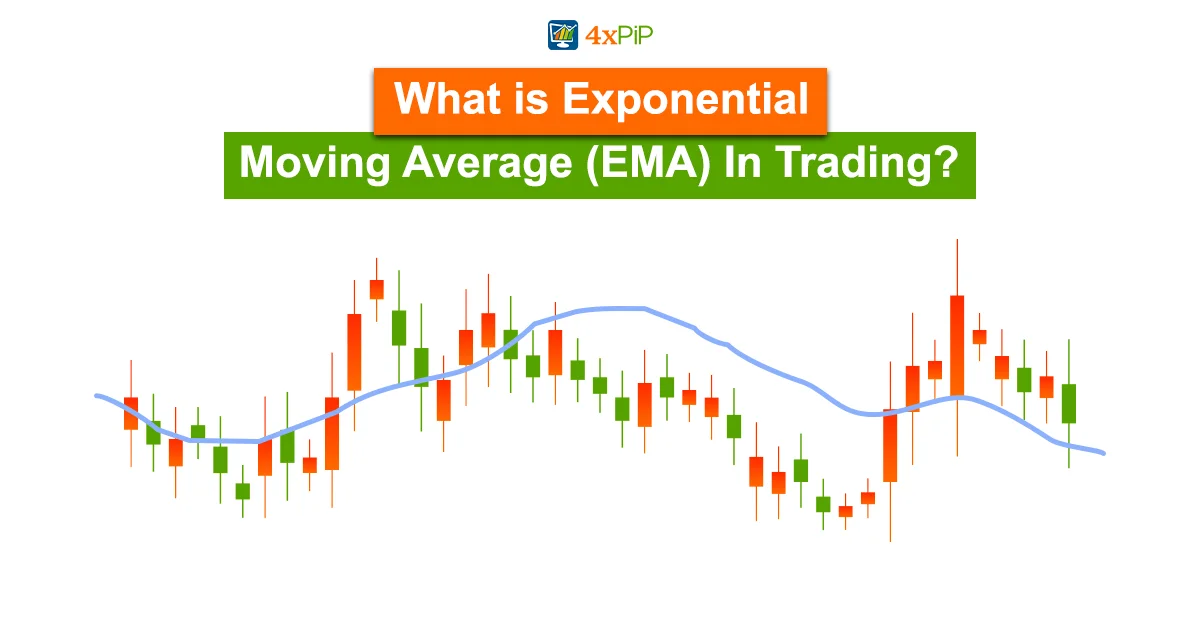
What Is The Exponential Moving Average (EMA) In Trading?
EMA, an acronym for “Exponential Moving Average,” represents a moving average that assigns more weight to the most recent prices in a data set. It acts as a technical indicator used in trading practices to demonstrate how the cost of an asset or security changes over a certain period. In the context of trading, practitioners commonly use EMAs to analyze price trends over a specific period. Unlike a simple moving average (SMA), which gives equal weight to all data points, an EMA assigns greater importance to recent prices, making it more responsive to underlying asset or security price changes.
The EMA calculation involves using a smoothing factor derived from the chosen period. Traders often prefer EMAs for their ability to react quickly to price movements, making them popular for short-term trend analysis.
Formula of EMA:
The formula for calculating the EMA involves two main components: the multiplier and the smoothing factor. The multiplier is derived from the chosen period for the EMA, and the smoothing factor determines the weight assigned to the recent price. Here’s the general formula:
EMAt = (Closet−EMAt−1) × Multiplier + EMAt−1
Where,
- EMAt is the EMA value at time t.
- Closet is the closing price of the asset or security at time t.
- EMAt−1 is the EMA value at the previous period.
- The Multiplier is calculated based on the chosen period.
The multiplier is calculated using the formula:
Multiplier = 2/N+1
- Where N is the chosen period.
How To Calculate the Exponential Moving Average (EMA) With an Example?
To calculate a 10-day Exponential Moving Average (EMA), you initially compute the Simple Moving Average (SMA) for the first 10 days. Subsequently, on the 11th day, you calculate the EMA by utilizing the previously computed SMA for the 10 days as the preceding EMA. A multiplier is incorporated into the formula to enhance the smoothness of the EMA, with a heightened emphasis on recent data points. The weighting assigned to current data points in the EMA is most pronounced when the time frame is short such as M1, M5, or M15.
The calculation of the Simple Moving Average (SMA) is simple. It involves adding up a stock’s closing prices over a specified period and dividing this sum by the number of observations within that timeframe. For instance, a 10-day SMA is determined by totaling the closing prices over the last 10 trading days and dividing the sum by 10.
Following that, you need to compute the multiplier employed for smoothing (weighting) the Exponential Moving Average (EMA), commonly derived from the formula [2 ÷ (number of observations + 1)]. For instance, in the case of a 10-day moving average, the corresponding multiplier would be
Multiplier = [2/ (10+1)] = 0.1818.
Ultimately, the following formula calculates the present Exponential Moving Average (EMA):
EMAt = (Closet−EMAt−1) × Multiplier + EMAt−1
The emphasis on the latest price is more pronounced in a shorter-period EMA than a longer-period EMA. Specifically, for a 10-period EMA, an 18.18% multiplier is applied to the most recent price data, whereas the weight reduces to 9.52% for a 20-period EMA.
Simple
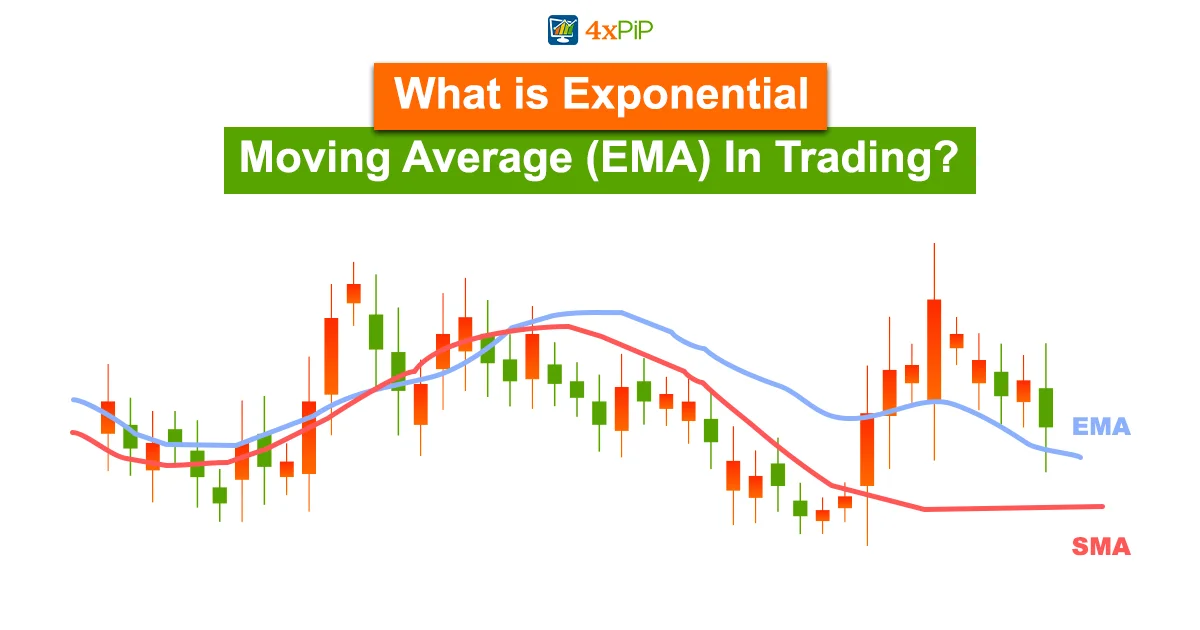
Moving Average Vs. Exponential Moving Average:
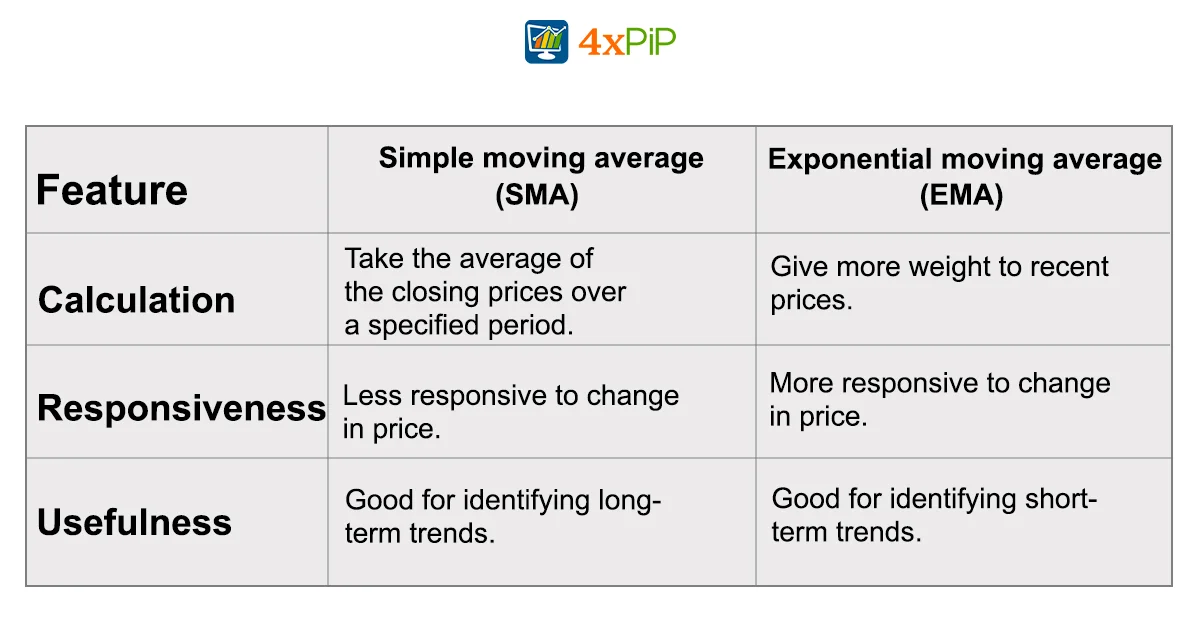
The main difference between an EMA and an SMA lies in the responsiveness each exhibits to alterations in the data incorporated in their respective calculations.
EMA assigns greater importance to recent prices, whereas the SMA treats all values equally. Despite this divergence in weighting methodology, both averages share similarities in their interpretation and find common usage among technical traders for smoothing out price fluctuations.
EMAs give more significance to recent data than older data; they exhibit a greater responsiveness to the latest price changes than SMAs. This responsiveness renders the results from EMAs timelier, elucidating why numerous traders favor them.
EMA Crossover Strategy in Trading:
An Exponential Moving Average (EMA) crossover strategy is significant in technical analysis where two EMAs with different periods intersect, indicating a potential change in the prevailing trend. Specifically, it involves crossing a shorter-term EMA over a longer-term EMA (bullish crossover) or vice versa (bearish crossover). Traders often interpret these crossovers as signals for potential entry or exit points in the market. A bullish crossover suggests a likely uptrend, while a bearish crossover indicates a possible downtrend. This approach is commonly employed to identify shifts in momentum and assist in making informed trading decisions. For example, Traders express a bullish sentiment when the 20 EMA crosses above or stays consistently above the 50 EMA. Conversely, they adopt a bearish outlook only if the 20 EMA falls below the 50 EMA.
The 4xPip MT4 EA Moving Average Crossover initiates trades based on the interaction between two moving average lines. It triggers Buy/Long orders when the 7-period Exponential Moving Average (EMA) crosses above the 14-period EMA and Sell/Short orders when the 7-period EMA crosses below the 14-period EMA. This EA provides flexibility for traders to adjust EMA settings, lot size, stop loss, take profit, and more. Furthermore, it incorporates features such as Trailing Stoploss, BreakEven, and Risk Percentage lot size to enhance trade management and optimize potential profits. You can take it from 4xPip.com.
What Is The Best EMA Strategy For Day Trading?
Day trading involves purchasing and selling securities/currencies within a single day, sometimes within seconds. In contrast to traditional investing, day trading focuses on leveraging the predictable price fluctuations that unfold over a trading session. Day traders predominantly practice it in stock and forex markets, where they actively trade currency pairs.
Whether a day trader employs a simple moving average or an exponential moving average, it’s advisable to use both types effectively to capture shorter or sell and longer or buy market trends within their trading timeframes. Traders commonly recommend using EMAs with periods of 9 and 21 days for intraday trading. Furthermore, this dual setup provides distinct perspectives on market trends and is often considered a valuable pair of EMAs for identifying crossovers and potential market breakouts.
Conclusion
In short, making the transition to the broader concept of moving averages is crucial in technical analysis. Whether they are simple moving averages (SMA) or EMAs, traders use them to gauge trends. Notably, EMAs, with their focus on recent prices, are favored for their responsiveness. However, ongoing debates on the significance of current market data highlight the need for careful consideration and effective risk management. Central to these considerations is the pivotal EMA crossover strategy; the best day trading approach often involves nuanced combinations of shorter and longer EMAs.
For forex, cryptocurrency, or stock traders, there’s an opportunity to connect with our team of experienced traders and programmers whose strategies have significantly impacted globally. At 4xPip, we provide top-notch indicators and expert advisors tailored to your specific requirements.
Moreover, our bots from 4xPip can assist you in crafting successful trading strategies. Seize the opportunity to unleash the full potential of your trading journey with 4xPip – your steadfast ally in achieving success.
FAQ’s
How to form an exponential moving average expert advisor (EA) that works on the phenomenon of EMA?
Reach out to [email protected] immediately to obtain your expert advisor (EA) for exponential moving averages on MT4 and MT5. 4xPip auto-trading EA knows when to open trade and how to maximize profit.
Where can you get a Moving Average (MA) crossover expert advisor (EA)?
You can get your Moving Average (MA) crossover expert advisor (EA) from 4xPip. Contact [email protected] today to acquire your EA and experience such convenience like never before.
From where I can download the exponential moving average (EMA) indicator?
You can download your exponential moving average (EMA) indicator from 4xPip. Contact [email protected] now to get your indicator and make your life easier than never before.
What is the best setting for EMA cross?
The optimal setting for EMA crossovers is specific to the particular market, timeframe, and trading approach. Frequently utilized EMA pairings encompass 5 and 9, 9 and 21, 20 and 50, and 200 and 100. Nonetheless, there is no universal setting applicable to all situations.
Is EMA crossover profitable?
Discovering a trading strategy that aligns with your style can be challenging, yet employing an EMA crossover strategy proves highly effective in aiding you to become a successful trader grounded in technical analysis.
What is the 5/20 EMA crossover strategy?
The 5/20 EMA Crossover Strategy centers around the convergence of the 5-day EMA and the 20-day EMA. This crossover triggeres when the shorter-term EMA intersects either above or below the longer-term EMA, signifying a potential shift in the trend.
What is EMA 20 and EMA 50?
The 50-day and 20-day EMA charts provide insights into a stock’s resistance and support levels. The support level marks where the stock price initiates a decline, whereas the resistance level indicates the point where the stock price starts an ascent. Optimal trade entry points often coincide with the breaking of the trend line.
What is the EMA value of a stock?
Traders commonly use the exponential moving average (EMA) as a technical chart indicator to monitor price fluctuations in a financial instrument over a specific period. Unlike the simple moving average (SMA), the EMA places greater significance on recent data points, particularly the latest prices.
What is the best EMA indicator?
Standard settings for the EMA indicator include 10 and 25 for quicker and more responsive curves or 100 and 200 periods for smoother and slower-moving curves. Individuals seeking a middle-ground EMA indicator may consider a period of 50 more suitable.
How Does the 5-8-13 EMA Crossover Work?
The crossover identifies momentum shifts, offering insights into potential substantial price movements in the short term. A bullish momentum occurs when the 5-EMA crosses over the 8 and 13 EMAs, while a bearish momentum is suggested when the opposite occurs.
What does the moving average tell you?
A moving average serves as a technical indicator employed by investors and traders to ascertain the trend direction of securities. This calculation involves summing up all data points in defined period and dividing the total by the number of periods. Technical traders utilize moving averages to generate trading signals.
Which indicator works best with EMA?
Integrate EMA with additional indicators such as RSI, MACD, or other moving averages to enhance decision-making processes, validate trend direction, and pinpoint overbought or oversold conditions.