Technical analysis is crucial in trading, providing traders with valuable insights into potential market movements. In financial markets, successful trading requires a combination of expertise, analysis, and reliable tools. The Head and Shoulders pattern is a potent indicator of potential trend reversals among the many chart patterns that traders leverage. This article, brought to you by 4xPip, a leading store specializing in automated trading solutions for MT4 and MT5 platforms, will delve into the intricacies of the Head and Shoulders pattern – exploring its characteristics, rules, and practical strategies for trading.
What Is The Head And Shoulders Chart Pattern?
The Head and Shoulders chart is a significant and widely recognized technical analysis pattern in financial markets, particularly in stocks, forex, and commodities trading. A reversal pattern often signals change in current trend, whether from an uptrend to a downtrend or vice versa.
The pattern gets its name from its visual resemblance to the human head and shoulders, consisting of three peaks (or troughs) resembling these body parts. The head and shoulders pattern stands out as a highly reliable signal for trend reversal, ranking among the top patterns indicating, with differing levels of precision, that an ongoing upward trend is approaching its conclusion. The Head and Shoulder pattern is mainly used to identify opportunities for Sell or Short trades. 4xPip acknowledges the significance of this pattern, especially when integrated with automated trading systems on MetaTrader platforms.
Understanding The Head And Shoulders Chart Pattern:
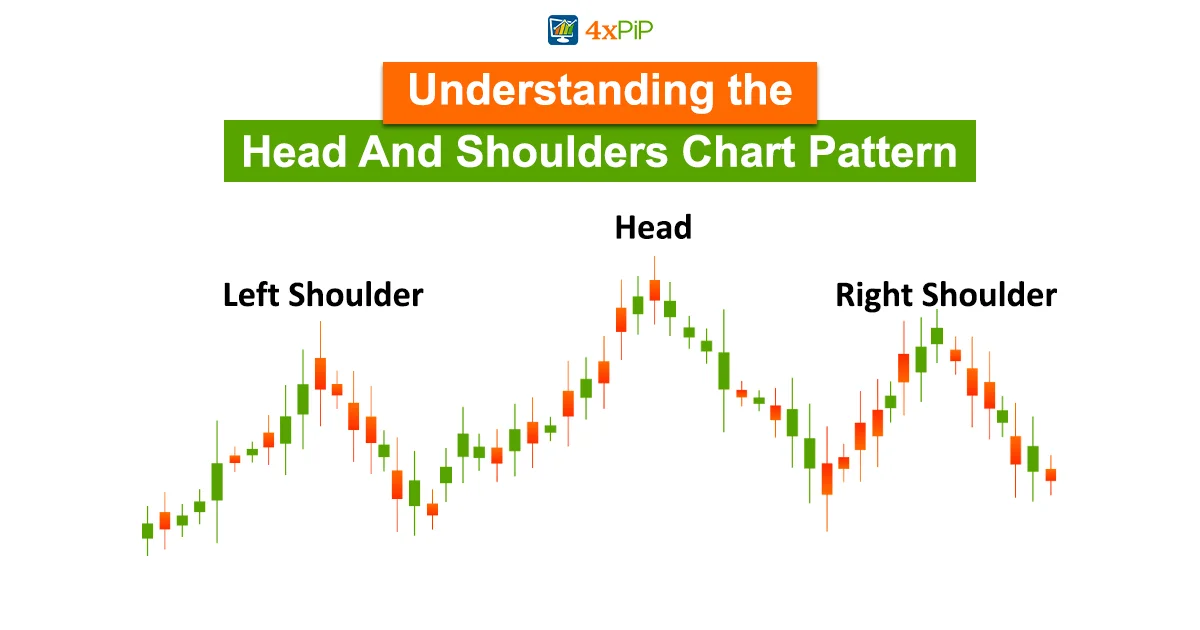
The Head and Shoulders pattern is a classic chart formation recognized for signaling potential reversals in the prevailing trend. A stock’s price creates the head and shoulders pattern when it reaches its highest point before declining to the level of the previous uptrend. The price then forms the “head” by ascending above the previous peak, after which it returns to its initial base. The stock price eventually reaches a new apex at approximately the same level as the initial summit of the formation, followed by a decline.
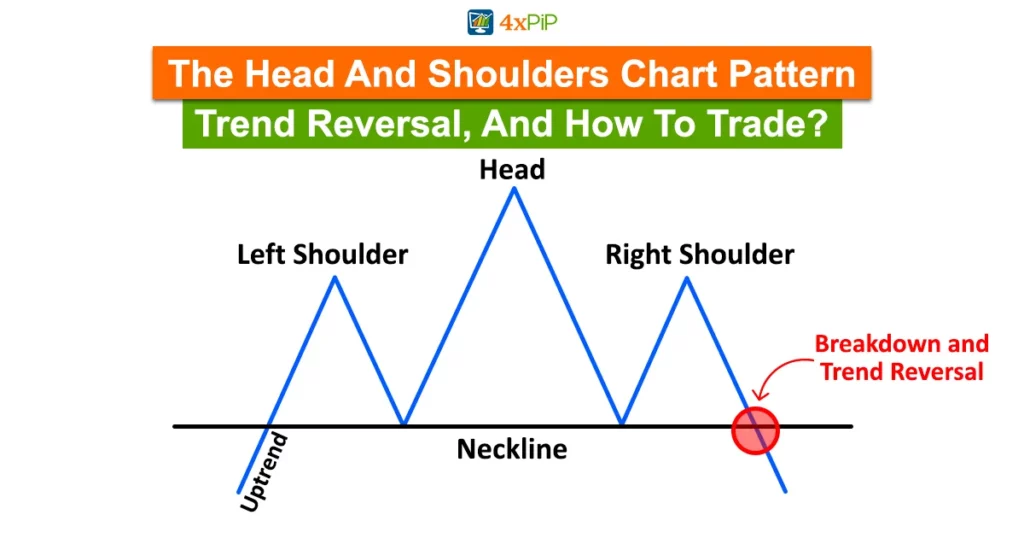
The pattern typically unfolds after a sustained uptrend and comprises four key components – the left shoulder, head, right shoulder, and Neckline.
Components of the Head and Shoulders Pattern:
- Left Shoulder (LH): This initial peak marks end of an uptrend and beginning of Head and Shoulders pattern.
- Head (H): Positioned at the highest point, the head represents a peak higher than both shoulders, signifying a potential reversal.
- Right Shoulder (RH): Following the head, the correct shoulder forms, with its peak lower than both the head and left shoulder, completing the pattern.
- Neckline: The neckline is sketched by connecting the two troughs or peaks (in the case of an inverse pattern). The neckline is crucial in confirming the potential reversal.
What Is An Inverse Head And Shoulders Pattern?
Combining the inverse head and shoulders pattern with other technical analysis indicators enhances trading signal reliability. Key indicators include moving averages for trend identification, RSI for overbought or oversold conditions, MACD for momentum and trend direction, volume oscillator for trend strength confirmation, Fibonacci retracement for support and resistance levels, Bollinger Bands for volatility measurement, and Stochastic Oscillator for identifying overbought or oversold conditions. In technical analysis, key indicators play a pivotal role in refining trading strategies, and 4xPip stands out as a leading source for acquiring these valuable trading tools. With 4xPip’s comprehensive range of indicators, traders gain a competitive edge in navigating complex financial markets. In conjunction with the inverse head and shoulders pattern, these indicators can provide comprehensive insights and confirmation signals for informed trading decisions.
What Are The Rules For Head And Shoulders Patterns?
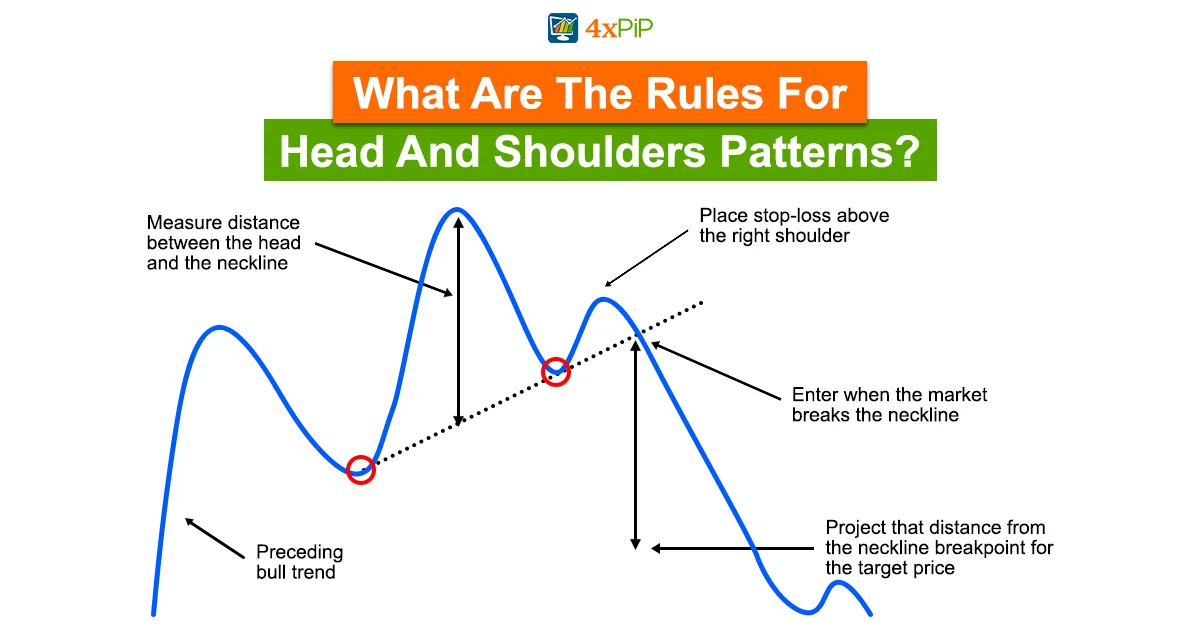
The Head and Shoulders pattern follows specific rules that traders typically adhere to when identifying and confirming the pattern. Here are the critical rules for recognizing a classic Head and Shoulders pattern:
- The Head and Shoulders pattern indicates a potential reversal and is most reliable when it forms after a prolonged uptrend.
- During the uptrend, the left shoulder forms when the price peaks, followed by a retracement.
- The head, characterized by a higher peak than the left shoulder, indicates increased buying pressure, and a price decline occurs after its formation.
- Right Shoulder (RH): The right shoulder, another peak lower than the head, forms after a retracement from the head. The right shoulder’s rise is generally similar in height to the left shoulder.
- The neckline, a trendline drawn horizontally across the lows of the left shoulder, head, and right shoulder, confirms the pattern when the price breaks below for a Head and Shoulders top or above for a Head and Shoulders bottom.
- Volume analysis is crucial for confirming the pattern. Typically, higher volume is observed during the formation of the left shoulder, followed by a decrease during the head and a subsequent increase during the right shoulder.
- The shoulders should be roughly symmetrical in height and width; a disproportionate pattern may indicate a weaker reversal signal.
-
What Is The Volume In A Head And Shoulders Chart Pattern?
The market volume is highly significant in the Head and Shoulders pattern context. Typically, as the price of a share increases, so does its trading volume. Generally, the Head and Shoulder pattern volume increases with the forming of the first (or left) shoulder. The shape of the first shoulder during periods of high volume signifies the aggressive nature of traders. Subsequently, a relatively lower volume forms the head, indicating that buyers are less aggressive.
Additionally, volume continues declining with the final shoulder, suggesting buyers are currently ceasing trading operations. Traders’ attention is subsequently directed towards selling due to the declining trajectory of prices. The chart reaches the neckline, signifying the completion of the pattern. Once the pattern breaks the neckline, it is anticipated that volume will increase once more giving more trading opportunities to traders.
Specific timeframes do not bind the Head and Shoulders Pattern, as it can materialize within minutes, days, or even months (M1, M5, M15, M30, H1, H4, D1, W1, MN1). Nonetheless, the pattern’s success potential tends to rise with longer timeframes, suggesting that extended durations increase the likelihood of a successful outcome.
How To Trade Head And Shoulders Chart Pattern?
The head and shoulders pattern is a distinctive chart configuration forecasting a shift from a bullish to a bearish trend. In contrast, an inverse head and shoulders pattern signifies the opposite – a reversal from bearish to bullish. Trading the Head and Shoulders chart pattern involves a systematic approach to identifying, confirming, and executing trades based on the pattern. Here is a step-by-step guide on how to trade the Head and Shoulders pattern:
Completion of Pattern:
Traders should exercise patience and wait for the full completion of a pattern. This precaution is crucial because a pattern might not materialize entirely, or a partially formed pattern may not reach completion in the future. While partial or nearly completed patterns warrant attention, it is advisable to refrain from making trades until the pattern definitively breaks the neckline.
Price Movement:
In the head and shoulders pattern, we anticipate the price action to descend below the neckline following the culmination of the right shoulder peak. Conversely, we expect price to ascend above the neckline in the inverse head and shoulders after forming the right shoulder.
Entry Points:
In the case of a Head and Shoulders top (bearish), contemplate entering a short or sell position when the price breaches the neckline. Conversely, for a Head and Shoulders bottom (bullish), Consider joining a long or buy position upon the price surpassing the neckline.
A trade can be initiated when a breakout occurs, breaking the neckline. Another entry point involves waiting for a pullback to the neckline, a more conservative approach that may be missed if the price continues in the breakout direction.
Take Profit Placement:
Stop-Loss Placement:
Enforce risk management through the placement of a stop-loss order. In the case of a Head and Shoulders top, position the stop-loss above the right shoulder. Conversely, place the stop-loss below the right shoulder for a Head and Shoulder bottom.
One of the most trustworthy trend reversal patterns is head and shoulders chart formation, signaling bullish to bearish trend reversal. An inverse head and shoulders pattern indicates a shift from a bearish to a bullish trend. The neckline rests at the support or resistance lines, depending on how the pattern is drawn.
Pros And Cons Of Head And Shoulders Chart Pattern:
Pros:
Cons:
- Like any technical pattern, false signals can occur. Traders may witness apparent formations that don’t result in a significant trend reversal, leading to potential losses.
- Not all patterns that start to form will necessarily be complete, making it challenging to rely solely on the presence of a Head and Shoulders pattern for trading decisions.
-
Conclusion:
In the dynamic world of trading, where expertise and analysis are paramount, the Head and Shoulders chart pattern emerges as a potent indicator of potential trend reversals. The Head and Shoulders pattern, a reliable signal for trend reversal, exhibits its distinctive formation resembling a human head and shoulders.
As presented by 4xPip, article covers not only traditional pattern but also its inverse counterpart, providing comprehensive understanding for traders. Including crucial indicators and their combination with inverse head and shoulders pattern emphasizes importance of holistic approach in technical analysis.
By detailing rules, entry-points, and risk management strategies, article equips traders with knowledge needed to navigate intricacies of the market. 4xPip provides traders with advanced indicators and expert advisors that integrate this pattern into their trading strategies seamlessly. By understanding the components, rules, and trading strategies associated with the Head and Shoulders pattern, traders can enhance their decision-making processes and successfully navigate the dynamic financial markets.