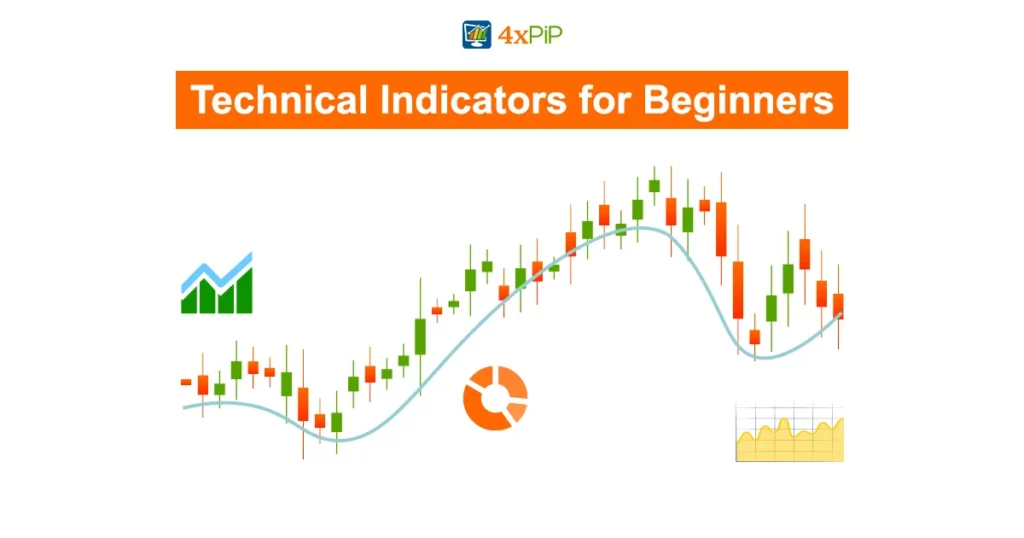
Technical Indicators for Beginners

technical-indicators-for-beginners

If you’re new to trading in markets like cryptocurrency, forex, or stocks, understanding technical indicators is crucial. These tools can provide valuable insights for both day trading and swing trading. In this article, we will explore technical indicators designed for beginners, with a focus on simplifying complex concepts. While we’re here at 4xPip, a trusted source for trading tools, we’re committed to providing you with essential knowledge that empowers you in your trading journey. So, let’s dive into the world of technical indicators, essential for informed trading decisions.

1.  Momentum Indicators:

Momentum indicators are a vital part of the trader’s toolkit in the world of forex, stocks, and cryptocurrency trading. These indicators help traders gauge the speed at which a particular asset’s price is changing, providing critical insights into market trends. For beginners, understanding and effectively using momentum indicators can be a game-changer in their trading journey. Here’s a brief explanation of momentum indicators followed by some key points to remember:

What Are Momentum Indicators?

Momentum indicators, in the context of trading, are mathematical calculations or visual representations that display the rate of change in an asset’s price. They are designed to help traders identify the strength or weakness of a trend, potential reversal points, and overbought or oversold conditions in the market.

Key Points:

Trend Strength: Momentum indicators, such as the Relative Strength Index (RSI) and the Moving Average Convergence Divergence (MACD), can help traders determine the strength of a price trend. A strong trend typically exhibits higher momentum.

Overbought and Oversold Conditions: These indicators also help traders identify when an asset might be overbought (too expensive) or oversold (too cheap). This can signal potential opportunities to enter or exit a trade.

Divergence: Keep an eye out for divergences between price movements and momentum indicators. Divergence can provide early signals of a potential trend reversal.

Confirmation:While momentum indicators are valuable, they are most effective when used in conjunction with other technical indicators and analysis methods to confirm trading decisions. Additionally, incorporating complementary tools such as trend lines and support/resistance levels can provide a more comprehensive view of market dynamics. This holistic approach not only enhances the reliability of signals but also helps traders mitigate the potential risks associated with relying solely on one type of indicator.

Timeframes: Consider the timeframe you are trading on. Short-term traders may use different momentum indicators compared to long-term investors.

Continuous Learning: Momentum indicators are a powerful tool, but they require a good understanding and continuous learning to use effectively. Beginners should spend time studying and practicing with these tools.

2.  Volume Indicators:

Understanding volume indicators is a fundamental aspect of trading, whether you’re dealing with cryptocurrencies, stocks, or forex. These indicators play a crucial role in assessing the market’s participation and the strength of a price movement. For beginners, comprehending the significance of volume indicators is essential in making informed trading decisions. Let’s start with a concise explanation of volume indicators, followed by key points to remember:

What Are Volume Indicators?

Volume indicators are technical tools that help traders evaluate the number of assets (stocks, cryptocurrency, currency pairs) that are bought or sold during a given time period. They provide insights into market activity and can help confirm the strength or weakness of a price trend.

Key Points:

Confirmation of Trends: Volume indicators are often used to confirm the strength of a trend. When trading volumes increase during an uptrend, it’s typically considered a bullish sign. Conversely, increased volumes during a downtrend can signal bearish sentiment.

Reversal Signals: Sudden spikes in volume can suggest a potential trend reversal. Traders pay attention to significant volume changes to identify turning points in the market.

Divergence: Just like with momentum indicators, the divergence between price movement and volume can be a powerful signal. Divergence can hint at potential trend shifts.

Interpreting Extreme Volumes: Extremely high or low trading volumes can indicate panic, euphoria, or exhaustion in the market. These extremes can provide insights into potential trend changes.

Combination with Other Indicators: To make well-informed decisions, it’s often beneficial to use volume indicators in combination with other technical indicators. This comprehensive approach can lead to more accurate trading strategies.

Timeframes Matter: The choice of timeframe is crucial when using volume indicators. Day traders may focus on shorter timeframes, while long-term investors might examine longer ones.

As a beginner trader, understanding and utilizing volume indicators can enhance your trading acumen. While the insights provided here offer a solid foundation, continuous learning, and practical experience are key to mastering these tools.

3.  Trend Indicators:

Trend indicators are essential tools in the trading world, applicable to a wide array of markets, including stocks, forex, and cryptocurrencies. They provide traders, both beginners and experienced, with crucial insights into the direction and strength of market trends. Understanding how trend indicators work is fundamental to making informed trading decisions. Here, we’ll begin with a brief explanation of trend indicators and then highlight key points for beginners to remember:

What Are Trend Indicators?

Trend indicators are technical tools designed to help traders identify the direction of a price trend. They can signal whether an asset’s price is moving up (an uptrend), down (a downtrend), or remaining relatively stable (a sideways trend). These indicators are invaluable in recognizing potential entry and exit points in the market.

Key Points

Trend Identification: Trend indicators, such as moving averages and trendlines, assist traders in recognizing the prevailing market direction. This is crucial for making the right trading decisions.

Strength of the Trend: These indicators can also provide insights into the strength of a trend. A strong trend is more likely to continue, while a weak trend might be nearing a reversal.

Crossovers: Some trend indicators use crossover points to signal changes in trend direction. For example, when a short-term moving average crosses above a long-term moving average, it may indicate an uptrend.

Support and Resistance: Trend indicators can help traders identify key support and resistance levels, which are essential for determining potential entry and exit points.

Timeframes: Depending on your trading style, you can adapt the timeframe of your trend indicators. Short-term traders often use shorter timeframes, while long-term investors look at longer ones.

Combination with Other Indicators: While trend indicators are powerful on their own, combining them with other technical tools, such as oscillators or volume indicators, can enhance your trading strategy.

For beginner traders, mastering trend indicators is a crucial step in building a solid foundation for trading success. It’s essential to dedicate time to learning and practicing with these tools to develop your skills further.

4xPip, a trusted source for trading tools and expert guidance, offers a range of including the MT5 Trend Indicator, the MT5 Super Trend Indicator, and the MT4 Super Trend Indicator. If you’re seeking additional support and resources, explore their offerings and consider consulting their experts for personalized guidance.

4.  Mean Reversion Indicators:

Understanding mean reversion indicators is a valuable asset for traders navigating the world of stocks, forex, and cryptocurrencies. These indicators play a vital role in identifying potential reversals in the price of assets. For beginners, comprehending how mean reversion indicators work is crucial to making well-informed trading decisions. Let’s begin with a concise explanation of mean reversion indicators, followed by key points for beginners to consider:

What Are Mean Reversion Indicators?

Mean reversion indicators are technical tools that help traders identify when an asset’s price is likely to move back to its average or “mean” value. They are based on the idea that, over time, prices tend to revert to a certain average or equilibrium level. These indicators aim to pinpoint potential buying or selling opportunities when prices deviate significantly from this average.

Key Points:

Mean Reversion Concept: Mean reversion indicators are built on the concept that prices that have deviated too far from their mean tend to revert or return to that mean value over time.

Overbought and Oversold Conditions: These indicators can signal overbought conditions (prices too high) or oversold conditions (prices too low). This can indicate potential opportunities to buy or sell.

Range-Bound Markets: Mean reversion indicators are particularly valuable in range-bound markets, where prices fluctuate within a specific range. In such markets, instead of following a strong trend, mean reversion indicators prove especially useful.

Understanding Averages: Traders should be familiar with the type of average used by the indicator; for instance, they may encounter simple moving averages (SMA) or exponential moving averages (EMA). Understanding these different types of averages is crucial for informed decision-making in the dynamic world of trading. Different averages can yield different results.

Combination with Other Indicators: For a comprehensive trading strategy, mean reversion indicators are often used in conjunction with other technical indicators to confirm signals.

Timeframes: The choice of timeframe can impact the effectiveness of mean reversion indicators. Short-term traders may use shorter timeframes, while long-term investors might opt for longer ones.

Mastering mean reversion indicators is a significant step for beginners seeking success in trading. These indicators can help you identify potential turning points in the market and optimize your trading decisions.

Mastering Technical Indicators:

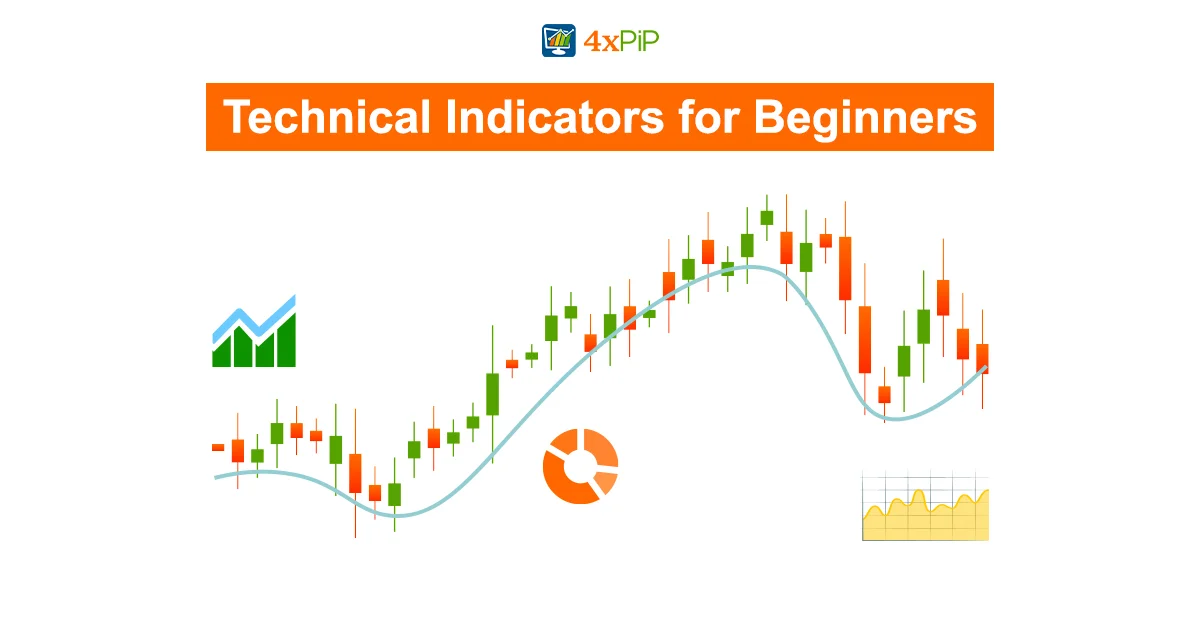
Technical indicators are the bedrock of trading in forex, stocks, and cryptocurrencies. Whether you’re a novice or an experienced trader, these tools provide critical insights into market dynamics. They cover Momentum Indicators that measure price change rates, Volume Indicators revealing market activity, Trend Indicators showing market direction, and Mean Reversion Indicators indicating potential reversals.

Understanding these indicators, their applications, and how to interpret them is essential. Mastery comes from knowing when and how to use them and combining them with other analytical tools. Trading is a continual learning process, and using technical indicators effectively can lead to informed decisions and financial success. Look out for more trading insights and risk management tips in our upcoming articles.

Strategies Beginners Use: For novice traders venturing into the world of financial markets, employing effective strategies is key to navigating the complexities of trading.While there’s no one-size-fits-all approach, integrating various technical indicators, such as Momentum, Volume, Trend, and Mean Reversion Indicators, can serve as a prudent starting point. Here are some beginner strategies to consider:

  • Trend Following:

One of the simplest strategies for beginners is trend following. Utilizing Trend Indicators like moving averages, traders aim to identify and ride existing trends. If a trend is up (bullish), traders look for buying opportunities, and if it’s down (bearish), they consider selling. This strategy requires patience and discipline, as it may involve holding positions for extended periods.

  • Counter-Trend Trading:

For those keen on catching potential reversals, Mean Reversion Indicators are their go-to. These traders watch for overextended moves, where prices have moved too far from their averages. They then speculate on a price reversal to the mean. However, while it can be rewarding, it’s important to exercise caution. Counter-trend trading, in particular, can be riskier for beginners.

  • Momentum Trading:

Momentum Indicators are popular among beginners. This strategy involves identifying strong trends and riding them. When the Momentum Indicator indicates a strong trend, traders open positions in the direction of that trend. This strategy requires vigilance, as it involves monitoring the market for trend changes.

Summary:

In this blog, we’ve explored essential technical indicators for beginners, including Momentum, Volume, Trend, and Mean Reversion Indicators. We’ve also introduced beginner-friendly trading strategies, such as trend following, counter-trend trading, and momentum trading. These tools and strategies can empower novice traders in the dynamic world of financial markets, providing valuable insights for making informed trading decisions. Mastering these tools can be your stepping stone to success in trading. Stay tuned for more insights and tips on trading and risk management in our upcoming articles.

FAQ's

Don't forget to share this post!

Technical Indicators for Beginners

technical-indicators-for-beginners

If you’re new to trading in markets like cryptocurrency, forex, or stocks, understanding technical indicators is crucial. These tools can provide valuable insights for both day trading and swing trading. In this article, we will explore technical indicators designed for beginners, with a focus on simplifying complex concepts. While we’re here at 4xPip, a trusted source for trading tools, we’re committed to providing you with essential knowledge that empowers you in your trading journey. So, let’s dive into the world of technical indicators, essential for informed trading decisions.

1.  Momentum Indicators:

Momentum indicators are a vital part of the trader’s toolkit in the world of forex, stocks, and cryptocurrency trading. These indicators help traders gauge the speed at which a particular asset’s price is changing, providing critical insights into market trends. For beginners, understanding and effectively using momentum indicators can be a game-changer in their trading journey. Here’s a brief explanation of momentum indicators followed by some key points to remember:

What Are Momentum Indicators?

Momentum indicators, in the context of trading, are mathematical calculations or visual representations that display the rate of change in an asset’s price. They are designed to help traders identify the strength or weakness of a trend, potential reversal points, and overbought or oversold conditions in the market.

Key Points:

Trend Strength: Momentum indicators, such as the Relative Strength Index (RSI) and the Moving Average Convergence Divergence (MACD), can help traders determine the strength of a price trend. A strong trend typically exhibits higher momentum.

Overbought and Oversold Conditions: These indicators also help traders identify when an asset might be overbought (too expensive) or oversold (too cheap). This can signal potential opportunities to enter or exit a trade.

Divergence: Keep an eye out for divergences between price movements and momentum indicators. Divergence can provide early signals of a potential trend reversal.

Confirmation:While momentum indicators are valuable, they are most effective when used in conjunction with other technical indicators and analysis methods to confirm trading decisions. Additionally, incorporating complementary tools such as trend lines and support/resistance levels can provide a more comprehensive view of market dynamics. This holistic approach not only enhances the reliability of signals but also helps traders mitigate the potential risks associated with relying solely on one type of indicator.

Timeframes: Consider the timeframe you are trading on. Short-term traders may use different momentum indicators compared to long-term investors.

Continuous Learning: Momentum indicators are a powerful tool, but they require a good understanding and continuous learning to use effectively. Beginners should spend time studying and practicing with these tools.

2.  Volume Indicators:

Understanding volume indicators is a fundamental aspect of trading, whether you’re dealing with cryptocurrencies, stocks, or forex. These indicators play a crucial role in assessing the market’s participation and the strength of a price movement. For beginners, comprehending the significance of volume indicators is essential in making informed trading decisions. Let’s start with a concise explanation of volume indicators, followed by key points to remember:

What Are Volume Indicators?

Volume indicators are technical tools that help traders evaluate the number of assets (stocks, cryptocurrency, currency pairs) that are bought or sold during a given time period. They provide insights into market activity and can help confirm the strength or weakness of a price trend.

Key Points:

Confirmation of Trends: Volume indicators are often used to confirm the strength of a trend. When trading volumes increase during an uptrend, it’s typically considered a bullish sign. Conversely, increased volumes during a downtrend can signal bearish sentiment.

Reversal Signals: Sudden spikes in volume can suggest a potential trend reversal. Traders pay attention to significant volume changes to identify turning points in the market.

Divergence: Just like with momentum indicators, the divergence between price movement and volume can be a powerful signal. Divergence can hint at potential trend shifts.

Interpreting Extreme Volumes: Extremely high or low trading volumes can indicate panic, euphoria, or exhaustion in the market. These extremes can provide insights into potential trend changes.

Combination with Other Indicators: To make well-informed decisions, it’s often beneficial to use volume indicators in combination with other technical indicators. This comprehensive approach can lead to more accurate trading strategies.

Timeframes Matter: The choice of timeframe is crucial when using volume indicators. Day traders may focus on shorter timeframes, while long-term investors might examine longer ones.

As a beginner trader, understanding and utilizing volume indicators can enhance your trading acumen. While the insights provided here offer a solid foundation, continuous learning, and practical experience are key to mastering these tools.

3.  Trend Indicators:

Trend indicators are essential tools in the trading world, applicable to a wide array of markets, including stocks, forex, and cryptocurrencies. They provide traders, both beginners and experienced, with crucial insights into the direction and strength of market trends. Understanding how trend indicators work is fundamental to making informed trading decisions. Here, we’ll begin with a brief explanation of trend indicators and then highlight key points for beginners to remember:

What Are Trend Indicators?

Trend indicators are technical tools designed to help traders identify the direction of a price trend. They can signal whether an asset’s price is moving up (an uptrend), down (a downtrend), or remaining relatively stable (a sideways trend). These indicators are invaluable in recognizing potential entry and exit points in the market.

Key Points

Trend Identification: Trend indicators, such as moving averages and trendlines, assist traders in recognizing the prevailing market direction. This is crucial for making the right trading decisions.

Strength of the Trend: These indicators can also provide insights into the strength of a trend. A strong trend is more likely to continue, while a weak trend might be nearing a reversal.

Crossovers: Some trend indicators use crossover points to signal changes in trend direction. For example, when a short-term moving average crosses above a long-term moving average, it may indicate an uptrend.

Support and Resistance: Trend indicators can help traders identify key support and resistance levels, which are essential for determining potential entry and exit points.

Timeframes: Depending on your trading style, you can adapt the timeframe of your trend indicators. Short-term traders often use shorter timeframes, while long-term investors look at longer ones.

Combination with Other Indicators: While trend indicators are powerful on their own, combining them with other technical tools, such as oscillators or volume indicators, can enhance your trading strategy.

For beginner traders, mastering trend indicators is a crucial step in building a solid foundation for trading success. It’s essential to dedicate time to learning and practicing with these tools to develop your skills further.

4xPip, a trusted source for trading tools and expert guidance, offers a range of including the MT5 Trend Indicator, the MT5 Super Trend Indicator, and the MT4 Super Trend Indicator. If you’re seeking additional support and resources, explore their offerings and consider consulting their experts for personalized guidance.

4.  Mean Reversion Indicators:

Understanding mean reversion indicators is a valuable asset for traders navigating the world of stocks, forex, and cryptocurrencies. These indicators play a vital role in identifying potential reversals in the price of assets. For beginners, comprehending how mean reversion indicators work is crucial to making well-informed trading decisions. Let’s begin with a concise explanation of mean reversion indicators, followed by key points for beginners to consider:

What Are Mean Reversion Indicators?

Mean reversion indicators are technical tools that help traders identify when an asset’s price is likely to move back to its average or “mean” value. They are based on the idea that, over time, prices tend to revert to a certain average or equilibrium level. These indicators aim to pinpoint potential buying or selling opportunities when prices deviate significantly from this average.

Key Points:

Mean Reversion Concept: Mean reversion indicators are built on the concept that prices that have deviated too far from their mean tend to revert or return to that mean value over time.

Overbought and Oversold Conditions: These indicators can signal overbought conditions (prices too high) or oversold conditions (prices too low). This can indicate potential opportunities to buy or sell.

Range-Bound Markets: Mean reversion indicators are particularly valuable in range-bound markets, where prices fluctuate within a specific range. In such markets, instead of following a strong trend, mean reversion indicators prove especially useful.

Understanding Averages: Traders should be familiar with the type of average used by the indicator; for instance, they may encounter simple moving averages (SMA) or exponential moving averages (EMA). Understanding these different types of averages is crucial for informed decision-making in the dynamic world of trading. Different averages can yield different results.

Combination with Other Indicators: For a comprehensive trading strategy, mean reversion indicators are often used in conjunction with other technical indicators to confirm signals.

Timeframes: The choice of timeframe can impact the effectiveness of mean reversion indicators. Short-term traders may use shorter timeframes, while long-term investors might opt for longer ones.

Mastering mean reversion indicators is a significant step for beginners seeking success in trading. These indicators can help you identify potential turning points in the market and optimize your trading decisions.

Mastering Technical Indicators:

Technical indicators are the bedrock of trading in forex, stocks, and cryptocurrencies. Whether you’re a novice or an experienced trader, these tools provide critical insights into market dynamics. They cover Momentum Indicators that measure price change rates, Volume Indicators revealing market activity, Trend Indicators showing market direction, and Mean Reversion Indicators indicating potential reversals.

Understanding these indicators, their applications, and how to interpret them is essential. Mastery comes from knowing when and how to use them and combining them with other analytical tools. Trading is a continual learning process, and using technical indicators effectively can lead to informed decisions and financial success. Look out for more trading insights and risk management tips in our upcoming articles.

Strategies Beginners Use: For novice traders venturing into the world of financial markets, employing effective strategies is key to navigating the complexities of trading.While there’s no one-size-fits-all approach, integrating various technical indicators, such as Momentum, Volume, Trend, and Mean Reversion Indicators, can serve as a prudent starting point. Here are some beginner strategies to consider:

  • Trend Following:

One of the simplest strategies for beginners is trend following. Utilizing Trend Indicators like moving averages, traders aim to identify and ride existing trends. If a trend is up (bullish), traders look for buying opportunities, and if it’s down (bearish), they consider selling. This strategy requires patience and discipline, as it may involve holding positions for extended periods.

  • Counter-Trend Trading:

For those keen on catching potential reversals, Mean Reversion Indicators are their go-to. These traders watch for overextended moves, where prices have moved too far from their averages. They then speculate on a price reversal to the mean. However, while it can be rewarding, it’s important to exercise caution. Counter-trend trading, in particular, can be riskier for beginners.

  • Momentum Trading:

Momentum Indicators are popular among beginners. This strategy involves identifying strong trends and riding them. When the Momentum Indicator indicates a strong trend, traders open positions in the direction of that trend. This strategy requires vigilance, as it involves monitoring the market for trend changes.

Summary:

In this blog, we’ve explored essential technical indicators for beginners, including Momentum, Volume, Trend, and Mean Reversion Indicators. We’ve also introduced beginner-friendly trading strategies, such as trend following, counter-trend trading, and momentum trading. These tools and strategies can empower novice traders in the dynamic world of financial markets, providing valuable insights for making informed trading decisions. Mastering these tools can be your stepping stone to success in trading. Stay tuned for more insights and tips on trading and risk management in our upcoming articles.
FAQ's

Don't forget to share this post!

Related Articles