We’ll break down Bollinger Bands, which are like a channel around a simple moving average. These are important for people trading in cryptocurrency, forex, stocks, and more. Bollinger Bands help you see support/resistance levels and market momentum at the same time. We’ll show you how they can help you find good times to start or stop trading, especially when the market is moving in a range. 4xPip can help, If you’re new to trading or want to get better. Check out our tools for trading: MT4 EA Bollinger Band and MT5 EA Bollinger Band. For more info and help, contact our customer support at [email protected].
Using Support and Resistance with Bollinger Bands:
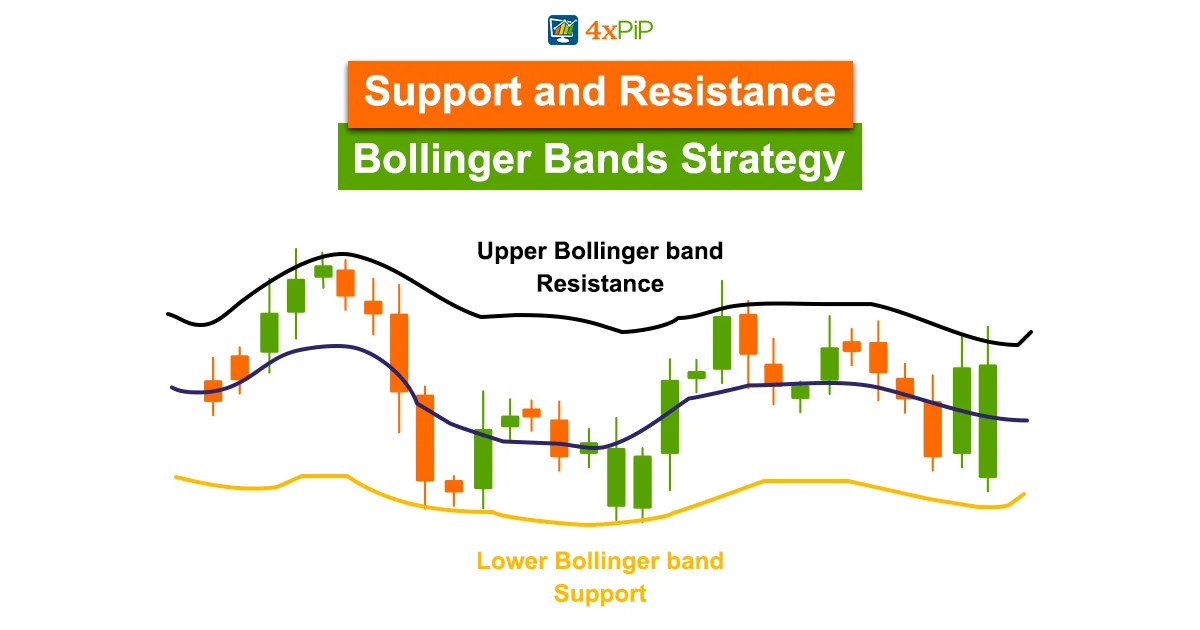
Bollinger Bands are like a channel made by drawing a line around a 20-period average price. This channel helps us see support and resistance levels and tells us if the market is moving a lot or a little.
Bollinger Bands are useful because they show when the market is calm or active. When things are quiet, the bands get closer, and when it’s busy, they spread out. Two main strategies, the Bollinger Bounce and Bollinger Squeeze, show how the bands act like dynamic support and resistance.
The bands also help us figure out if prices might go up or down. When prices get close to the bottom band, it could be a good time to buy. When they approach the top band, it might be a good time to sell. However, it’s important to know that Bollinger Bands work best when the market is not going strongly in one direction.
To use Bollinger Bands well, understand that they show both support and resistance levels and how fast prices are moving. The wider the bands, the more the prices are changing. But remember, Bollinger Bands work best when the market isn’t going strongly in one direction.
For smart trading, use Bollinger Bands to decide when to buy or sell. If prices are near the bottom band, think about buying. If they’re near the top band, think about selling. Manage your risks by understanding the chances of prices going outside the bands. Set stop-loss, take-profit, and lot size based on the band width and the market trend. Improve your trading strategies with the power of Bollinger Bands through our amazing tools – the MT4 EA Bollinger Band and MT5 EA Bollinger Band offered by 4xPip
Bollinger Bands As Support and Resistance:
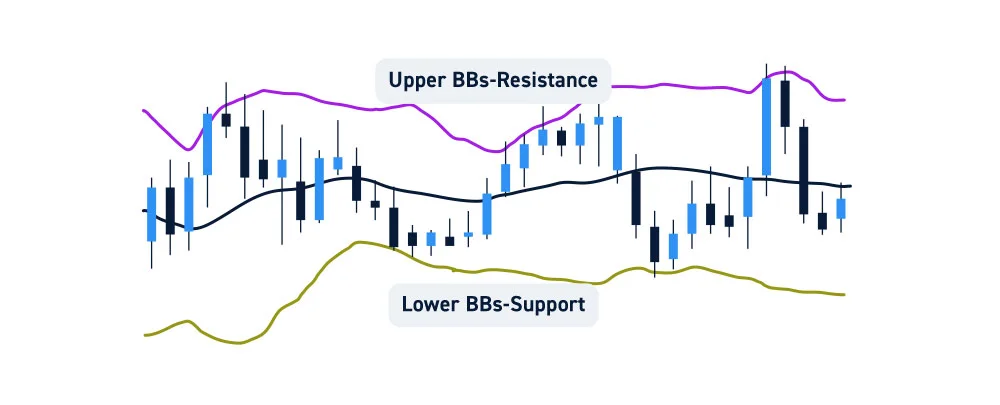
Bollinger Bands are like guides in trading that show where prices might go. They act as both supporters and blockers for prices. Picture them as a path around an average price line.
What makes Bollinger Bands special is that they consider how much prices usually go up or down. This helps traders see not just where prices might stop, but also how fast they are moving.
One good thing about Bollinger Bands is that they can tell us when the market is calm or active. When the bands are close together, things are calm. When they spread out, the market is busy. Traders often see prices going back to the middle of the bands, showing a pattern. There are two common ways to use Bollinger Bands: the “Bollinger Bounce,” where prices hit the bands and bounce back, and the “Bollinger Squeeze,” which suggests a big move is coming.
Bollinger Bands are usually set up with a 20-period average line and lines that are two steps away on each side. This helps us see how prices usually act. They work well when prices stay in a range, going up and down between the bands. But in strong trends, like a very strong up or down movement, Bollinger Bands might not keep up quickly.
Traders use Bollinger Bands to make smart choices. They look at the chance of prices staying between the bands or breaking out. Bollinger Bands are not just lines on a chart; they are tools that help traders deal with the ups and downs of the financial markets also check out 4xPip’s tools for trading, including the MT4 EA Bollinger Band and MT5 EA Bollinger Band.
MT4 EA Bollinger Band:
DOWNLOAD NOWMT5 EA Bollinger Band:
DOWNLOAD NOWHow Support and Resistance Bollinger Bands Define Market Trends:
It’s important to grasp market trends. One useful tool for this is the Support and Resistance Bollinger Bands strategy. Bollinger Bands are like a channel made from a Simple Moving Average (SMA). They give traders a way to see both Support/Resistance (S/R) levels and momentum. The default setting, “20,2,” makes a 20-period SMA with a band plotted at 2 standard deviations. This creates a channel reflecting market volatility. Wide bands mean more volatility, and narrow bands suggest a possible breakout. Traders use Bollinger Bands to identify the ups and downs in market activity.
Bollinger Bands work as S/R indicators and momentum trackers. Wide channels show high volatility and strong momentum. Narrow bands suggest a potential breakout. As the market often returns to the middle of the bands, traders use the Bollinger Bounce strategy. This takes advantage of the dynamic support and resistance levels the bands create. Longer time frames make these bands stronger, showing their importance in trend analysis. But note, Bollinger Bands work best in range-bound markets, where their S/R function is most useful. The bands act like a rubber band, stretching to contain most price movements, with a 95% chance of prices staying within the 4 standard deviation channel.
When trading, an important questions arise: When to buy? When to sell? Bollinger Bands help answer these. A buy trade is good when prices touch or go below the lower band, signaling a potential upward move. A sell trade is wise when prices test or break above the upper band, suggesting a likely downward path. Risk management is key to successful trading. Bollinger Bands help set suitable stop-loss and take-profit levels based on statistical probability. This minimizes losses and maximizes profits. Determining the right lot size is crucial for risk management, Bollinger Bands guide this decision by offering insights into market volatility. If you are looking to improve your trading skills with Bollinger Bands check out MT4 EA Bollinger Band and MT5 EA Bollinger Band
Strategic Edge of Bollinger Bands Support and Resistance:
Bollinger Bands are a useful tool that can give traders an advantage. They’re like lines around the average price, showing potential high and low points. This helps traders see where the market might go and how strong the momentum is.
Bollinger Bands are especially helpful when the market is changing a lot. The bands get wider when the market is active and narrower when it’s calm. One useful thing to know is that prices often go back to the middle of the bands. Traders use two main strategies with Bollinger Bands: the “Bollinger bounce,” where the bands act like a bounce back point, and the “Bollinger squeeze,” which suggests a big move is coming when the bands get tight.
For traders using Bollinger Bands, it’s crucial to understand their role in spotting trends. These bands are created by drawing lines around an average price, forming a channel. The default settings are often “20,2,” but you can change them based on what you like. The width of the bands shows how much the prices are changing, making them helpful for figuring out momentum. Keep in mind that Bollinger Bands work best when the market is moving sideways, as they act like rubber bands, guiding entry and exit points for traders.
Summary:
Discover the power of Bollinger Bands with 4xPip’s tools for trading, including the MT4 EA Bollinger Band and MT5 EA Bollinger Band. Utilizing Bollinger Bands, traders can identify support and resistance levels, gauge market momentum, and make informed trading decisions across various financial markets. For more information and assistance, reach out to our customer support at [email protected].
FAQs
What are Bollinger Bands?
Bollinger Bands are a technical analysis tool consisting of a moving average and two standard deviation lines, helping traders identify market volatility and potential price levels.
How do Bollinger Bands work?
Bollinger Bands indicate market volatility by expanding or contracting based on price movements, serving as dynamic support and resistance levels for traders.
What strategies can be used with Bollinger Bands?
Common strategies include the “Bollinger Bounce,” where prices rebound off the bands, and the “Bollinger Squeeze,” indicating potential breakouts.
When is the best time to use Bollinger Bands?
Bollinger Bands are most effective in sideways or ranging markets, where they provide clear support and resistance levels.
How are Bollinger Bands useful for risk management?
Traders can use Bollinger Bands to set appropriate stop-loss and take-profit levels based on statistical probabilities, helping minimize losses and maximize profits.
Can Bollinger Bands predict market trends?
While Bollinger Bands can’t predict trends outright, they provide valuable insights into market volatility and potential reversal points.
What factors affect the effectiveness of Bollinger Bands?
The effectiveness of Bollinger Bands can be influenced by market conditions, timeframe used, and the settings chosen (such as period and standard deviation).
Are Bollinger Bands suitable for all types of markets?
Bollinger Bands are most suitable for range-bound markets, where they excel in identifying potential entry and exit points for traders.
How do traders determine buy and sell signals using Bollinger Bands?
Buying signals occur when prices touch or dip below the lower band, suggesting potential upward movement, while selling signals arise when prices test or breach the upper band, indicating a potential downward trajectory.
Can Bollinger Bands be customized based on individual trading preferences?
Yes, traders can adjust the parameters of Bollinger Bands, such as the period and standard deviation, to align with their trading strategies and preferences.


