Custom MACD – Moving Average Convergence Divergence Indicator for MetaTrader 5
$0.00
The Custom MACD Indicator for MetaTrader 5 helps traders identify trend direction, strength, and potential reversals. It works by measuring the difference between two moving averages and generates visual and alert-based signals when a crossover occurs. The tool sends real-time phone alerts when a buy or sell signal appears, allowing traders to react quickly even when away from their charts.
Description
What is the Custom MACD Indicator for MetaTrader 5?
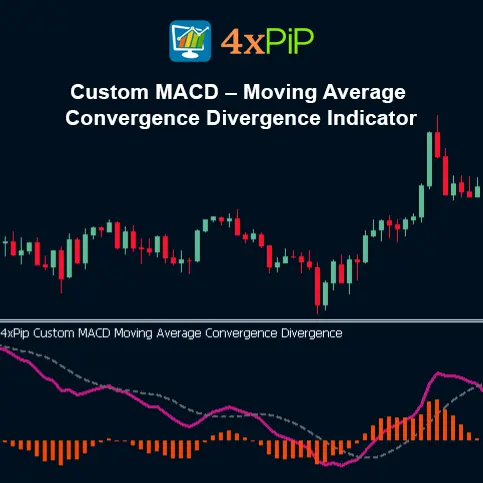
The Custom MACD is an upgraded version of the classic MACD (Moving Average Convergence Divergence) indicator. It combines the traditional MACD calculation with enhanced visual design and push notification alerts. The indicator plots a MACD line, a signal line, and a histogram that shows the difference between the two lines. It helps traders see when market momentum is changing and when new trends may start.
How Does the Custom MACD Work?
The Custom MACD uses exponential moving averages (EMAs) to measure momentum:
- The MACD Line is the difference between a fast EMA and a slow EMA.
- The Signal Line is a moving average of the MACD Line.
- The Histogram shows the distance between the MACD Line and Signal Line.
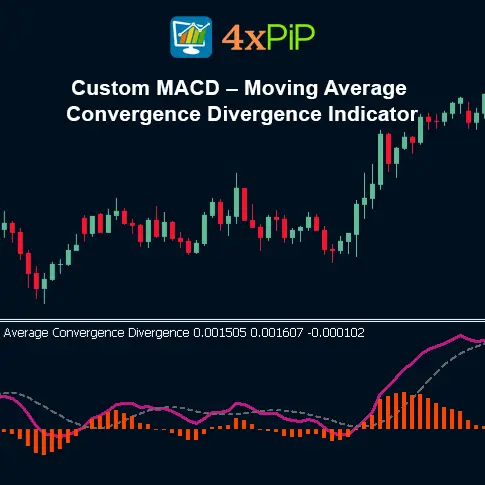
When the MACD Line crosses above the Signal Line, it suggests a bullish signal (buy).
When the MACD Line crosses below the Signal Line, it suggests a bearish signal (sell).
The indicator displays these signals on the chart using colored lines and a histogram, and it can also send alerts directly to your mobile device.
Why Should Traders Use the Custom MACD?
This version of the MACD is designed for traders who want faster reaction time and better clarity. With automatic alerts and a clean visual layout, traders can monitor multiple charts without missing signals. It’s ideal for all trading styles like scalping, day trading, and swing trading across forex, stocks, and commodities.
How Does the Custom MACD Indicator for MT5 Provide More Accurate Buy and Sell Signals?
The Custom MACD Indicator for MT5 improves accuracy by filtering market noise and focusing on strong momentum shifts. Unlike the default MACD, it uses enhanced smoothing and optimized signal calculations. This helps traders spot trend changes earlier and avoid false entries. When the MACD line crosses the signal line with strong momentum, it gives a clear buy or sell signal.
It also plots color-changing histograms and alert notifications, so traders can react immediately without watching charts all day. The indicator highlights strong breakout moments, trend continuation setups, and reversal zones. Because it updates in real time, traders can see when momentum is increasing or fading. This makes trade entries and exits more confident and more accurate.
Advantages
- Customizable input settings for enhanced precision across different market conditions.
- Advanced visual clarity with colored histogram bars for momentum strength.
- Works on all timeframes, from scalping to long-term trading.
- Compatible with all MT5 assets including Forex, crypto, indices, stocks, and commodities.
- Reduces market noise by smoothing price movements with EMAs.
- Helps identify trend reversals before price action fully shifts.
- Assists with divergence recognition for early entry or exit signals.
- Low resource usage, keeping MT5 charts fast and responsive.
- Ideal for strategy testing and automated trading when combined with EAs.
- Improves risk management by confirming trend strength before trade execution.
Features
- Adjustable Fast EMA period.
- Adjustable Slow EMA period.
- Adjustable Signal SMA/EMA period.
- MACD Line + Signal Line plotted simultaneously.
- Dynamic color-changing histogram for bullish and bearish momentum.
- Zero-line crossover alerts for entry timing.
- Signal-line crossover alerts for confirmations.
- Auto-scaling for clean visualization on any chart.
- Works with multiple chart windows and templates.
- Lightweight coding for high-speed execution.
How to Trade
Use the Custom MACD to trade trend reversals and momentum shifts. Enter a buy trade when the MACD line crosses above the signal line and the histogram turns positive, confirming bullish momentum. Place your stop loss below the most recent swing low for protection. Close the position when the MACD crosses back below the signal line or when histogram momentum weakens. Mobile alerts allow quick entries even when you’re not watching the chart.
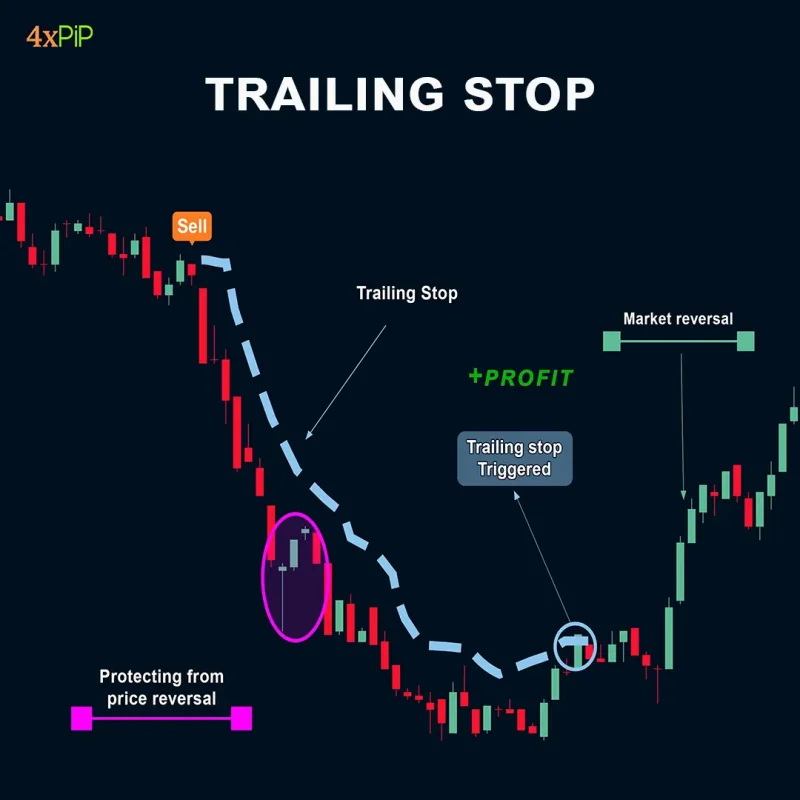
For sell trades, enter when the MACD line crosses below the signal line and the histogram turns negative, signaling bearish momentum. Set your stop loss above the recent swing high to minimize risk. Exit when the MACD lines cross upward again or histogram strength fades. This works on all timeframes, but traders often use M15–H1 for cleaner signals. The customizable EMA settings help you adapt to fast or slow market conditions.
MACD Calculation Formula
MACD Line: (12-day EMA – 26-day EMA)
Signal Line: 9-day EMA of MACD Line
MACD Histogram: MACD Line – Signal Line
Conclusion
The Custom MACD Indicator for MetaTrader 5 is a powerful momentum-tracking tool designed to offer more flexibility, clearer signals, and stronger chart insights than the standard MT5 MACD. With adjustable EMA periods, a precision-filtered histogram, and real-time crossover signals, traders can make informed decisions with greater accuracy. Whether used for scalping, day trading, or long-term analysis, this tool simplifies momentum interpretation and helps improve trade timing and performance.
DOWNLOAD NOW Reach Us on WhatsApp
 Fly Over to Telegram
 Drop Us an Email
FAQ's
Q & A
Related products
-
 Premium
MT5 BreakEven EA
Original price was: $99.00.$10.00Current price is: $10.00. Select options -
 Premium
MT5 License System for Trading bots EA
Original price was: $199.00.$99.00Current price is: $99.00. Select options -
 Premium
MT5 Trailing Stop EA
Original price was: $99.00.$10.00Current price is: $10.00. Select options -
 Premium
Forex Scanner: Dashboard Scanner for MT5 | Market Scanner
Original price was: $299.00.$199.00Current price is: $199.00. Select options
Reviews
There are no reviews yet