In this article, 4xPip is shedding light on the momentum indicator and the technical tools used to measure the momentum in this article. The momentum indicator is one of the best indicators utilized for trading. For a deep understanding, read the whole article. 4xPip has also written articles on other indicators and Expert Advisors (EAs), to get information you can visit our website.
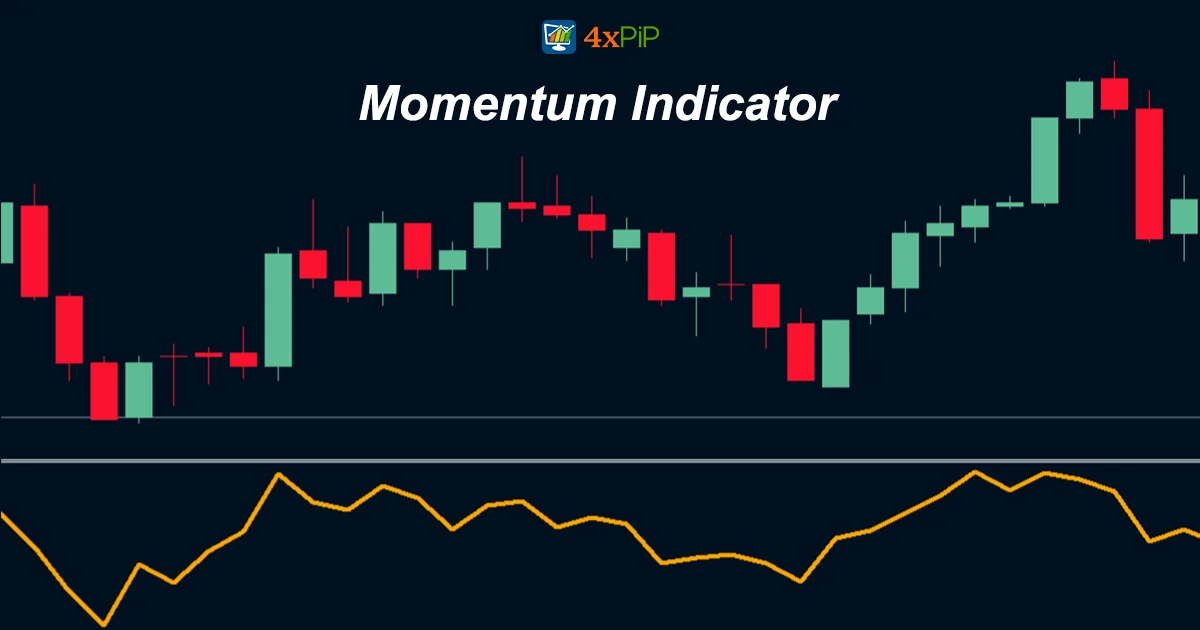
Momentum indicators measure the rate of change in a security’s price and help identify trends and reversals while gauging the strength of a trend.
Momentum indicators typically bind between two extreme levels, usually 0 and 100. When the indicator reaches either extreme, traders interpret it as suggesting that the security is overbought or oversold, indicating a potential reversal.
Traders use momentum indicators to generate buy and sell signals. For instance, when a momentum indicator crosses above its center line, it interprets it as a bullish signal. Conversely, when a momentum indicator crosses below its center line, they interpret it as a bearish signal.
Technical Tools to Measure Momentum:
- Moving Average Convergence Divergence:
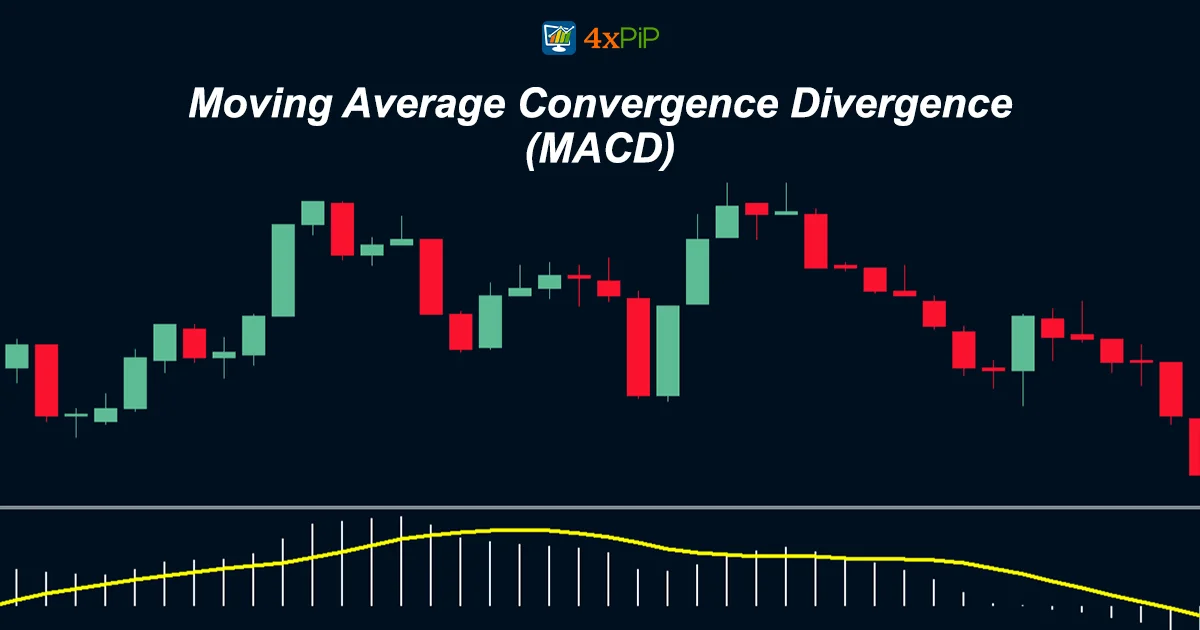
The Moving Average Convergence Divergence (MACD) is a trend-following momentum indicator that shows the relationship between two moving averages of a security’s price. To calculate it, subtract the 26-period exponential moving average (EMA) from the 12-period EMA. Plot a nine-period EMA of the MACD line (known as the “signal line”) on top of the MACD line.
Traders use the MACD to generate buy and sell signals. When the MACD line crosses above the signal line, it is a bullish signal. When the MACD line crosses below the signal line, it is a bearish signal.
Here is a simplified explanation of how to calculate the MACD:
- Calculate the 12-period EMA and the 26-period EMA of the security’s price.
- Subtract the 26-period EMA from the 12-period EMA to create the MACD line.
- Calculate a nine-period EMA of the MACD line to create the signal line.
- Plot the MACD line and the signal line on a chart.
How to interpret the MACD:
The MACD line can be interpreted in several ways. One simple way to interpret it is to look for crossovers between the MACD line and the signal line. When the MACD line crosses above the signal line, it is a bullish signal. When the MACD line crosses below the signal line, it is a bearish signal.
Another way to interpret the MACD line is to look at its direction. When the MACD line is trending upwards, it suggests that momentum is bullish. When the MACD line is trending downwards, it suggests that momentum is bearish.
Traders can also use the MACD to identify divergences. A divergence occurs when the price of a security is moving in one direction, but the MACD line is moving in the opposite direction. Divergences can be a warning sign that a trend reversal is imminent.
4xPip has designed a MACD Indicator. You can get your hands on this Indicator by clicking on this link MT5 MACD Explained Indicator.
- Rate of Change:
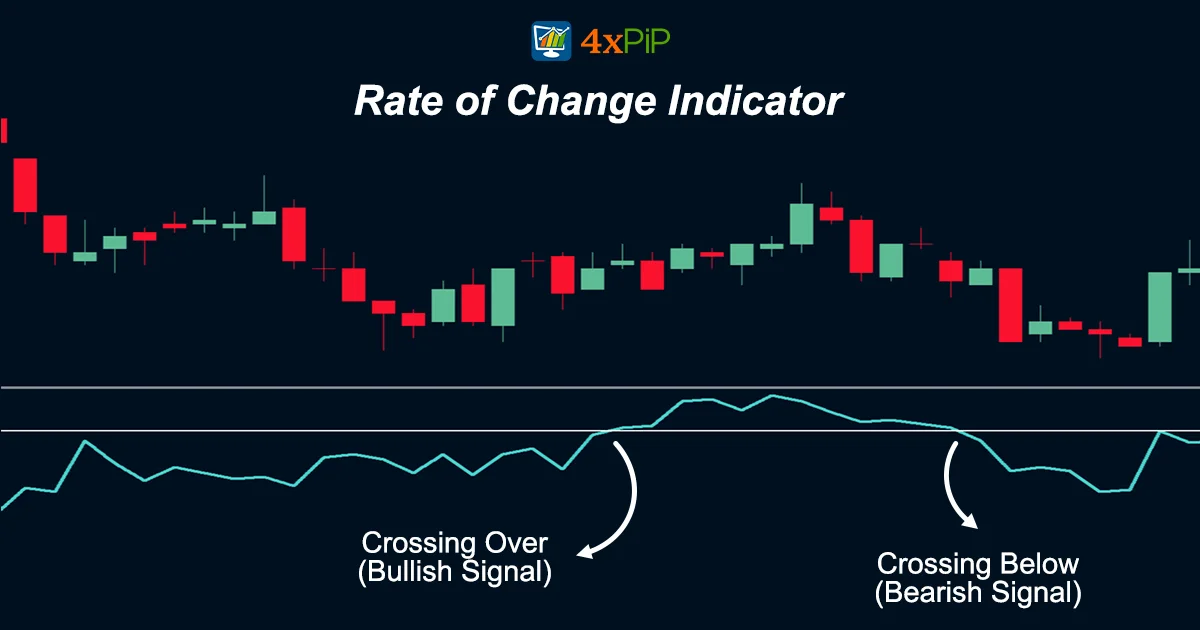
To calculate the Rate of Change (ROC), subtract the security’s price at a previous point in time from its current price and then divide the difference by the security’s price at the previous point in time. For ROC interpretation:
- A positive ROC indicates that the security is trending higher.
- A negative ROC indicates that the security is trending lower.
The ROC can also generate buy and sell signals.
For example, if a security’s ROC crosses above zero, it suggests a bullish signal. Conversely, if a security’s ROC crosses below zero, it suggests a bearish signal.
The ROC can also identify divergences. A divergence occurs when the price of a security is moving in one direction, but the ROC is moving in the opposite direction. Divergences can be a warning sign that a trend reversal is imminent.
Rate of Change Calculation:
Use the following formula to calculate ROC:
ROC = (Current Price – Previous Price) / Previous Price * 100
For example, if a security’s current price is $100 and its price at the previous point in time was $90, the ROC will be as follows:
ROC = (100 – 90) / 90 * 100 = 11.11%
Rate of Change Interpretation:
There are several ways to interpret ROC. One simple way to interpret it is to look for crossovers above and below zero. When the ROC crosses above zero, it is a bullish signal. When the ROC crosses below zero, it is a bearish signal.
Another way to interpret the ROC is to look at its direction. When the ROC is trending upwards, it suggests that momentum is bullish. When the ROC is trending downwards, it suggests that momentum is bearish.
Traders can also use the ROC to identify divergences. A divergence occurs when the price of a security is moving in one direction, but the ROC is moving in the opposite direction. Divergences can be a warning sign that a trend reversal is imminent.
- Stochastic Oscillator:
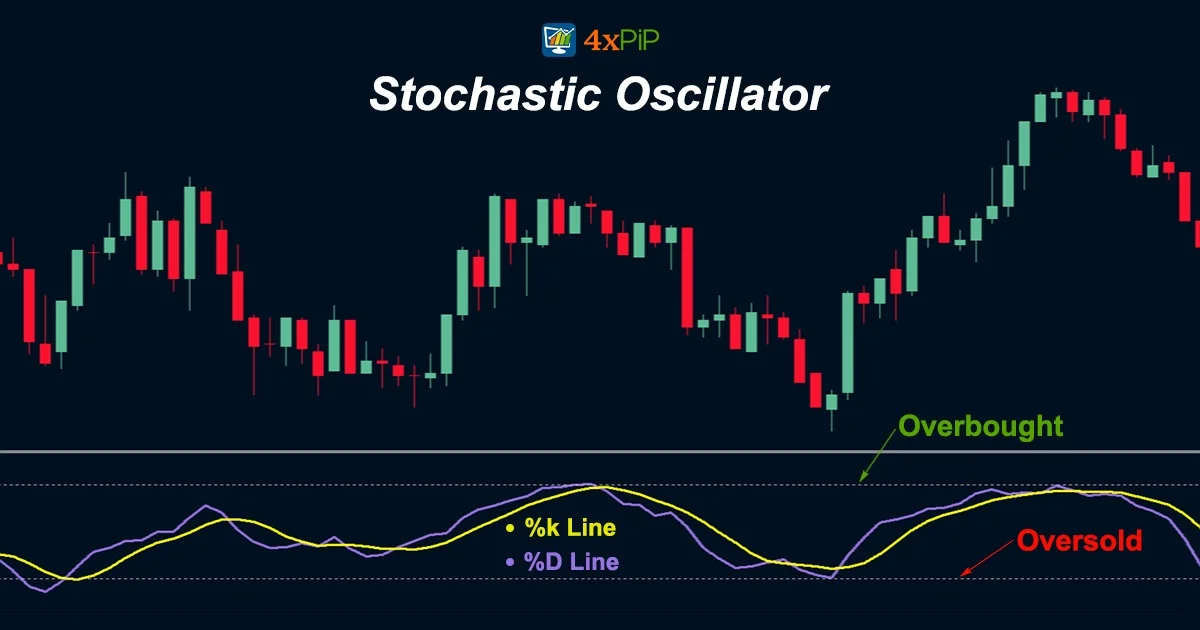
The stochastic oscillator is a momentum indicator that measures the closing price of a security relative to its price range over a given period. It also identifies overbought and oversold conditions and to generate buy and sell signals.
To calculate stochastic oscillator, you will need two moving averages of the security’s price. The %K line is a fast-moving average, and the %D line is a slower-moving average. To calculate the %K line, use a 9-period time frame, and for the %D line, use a 3-period time frame.
Technical analysts display the stochastic oscillator as an oscillator, which is a line graph that moves between two extremes. The stochastic oscillator has a range of 0 to 100, with readings above 80 considered overbought and readings below 20 considered oversold.
Traders use the stochastic oscillator to generate buy and sell signals. When the %K line crosses above the %D line, it is a bullish signal. When the %K line crosses below the %D line, it is a bearish signal.
Traders can also use the stochastic oscillator to identify divergences. A divergence occurs when the price of a security is moving in one direction, but the stochastic oscillator is moving in the opposite direction. Divergences can be a warning sign that a trend reversal is imminent.
- Relative Strength Index:
The Relative Strength Index (RSI) is a momentum indicator that measures the magnitude of recent price changes to evaluate overbought or oversold conditions in the price of a stock or other asset.
Technical analysts display the Relative Strength Index (RSI) as an oscillator (a line graph that moves between two extremes). They calculate the RSI using a formula that takes into account the magnitude of recent price changes to evaluate overbought or oversold conditions in the price of a stock or other asset.
4xPip has developed a Relative Strength Index Indicator. You can download it using the link given below:
Relative Strength Index Calculation:
The RSI is calculated using the following formula:
RSI = 100 – (100 / (1 + Average Gain / Average Loss))
The Average Gain is calculated by taking the average of the closing price increases over a specified period, typically 14 days. The Average Loss is calculated by taking the average of the closing price decreases over the same period.
Relative Strength Index Interpretation:
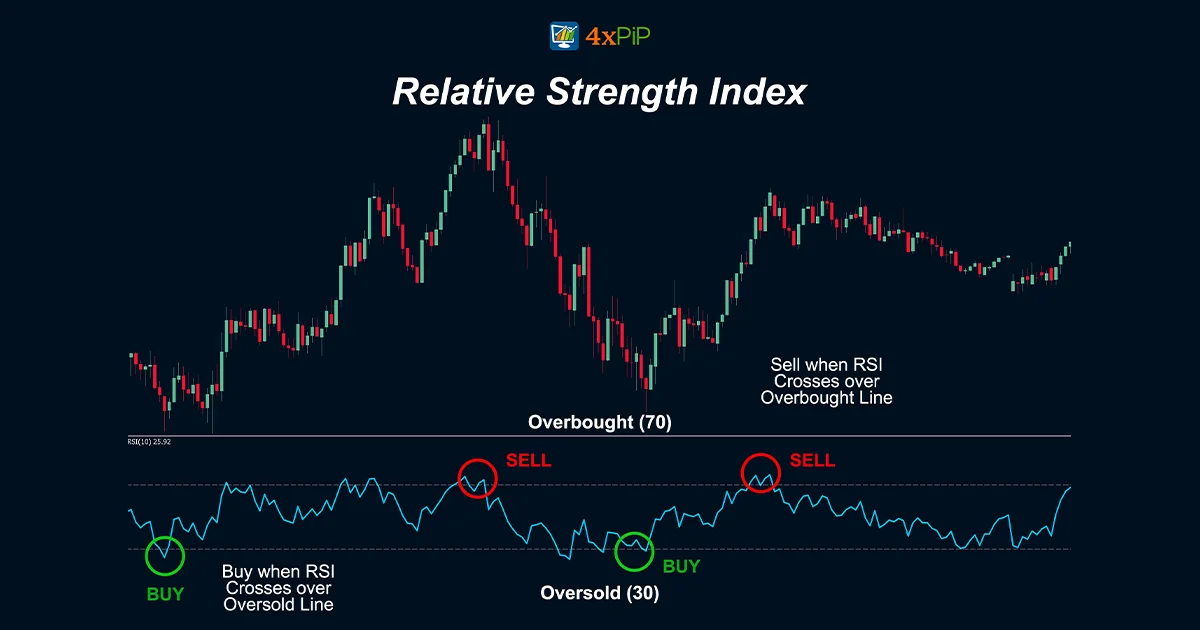
The RSI is displayed as a line graph that moves between 0 and 100. Readings above 70 are typically considered to be overbought, while readings below 30 are typically considered to be oversold.
Traders use the RSI to generate buy and sell signals. When the RSI crosses above 30, it is a bullish signal. When the RSI crosses below 70, it is a bearish signal.
Traders can also use the RSI to identify divergences. A divergence occurs when the price of a security is moving in one direction, but the RSI is moving in the opposite direction. Divergences can be a warning sign that a trend reversal is imminent.
Summary:
4xPip has provided in-depth knowledge about the momentum indicators. Momentum indicators are essential tools in technical analysis for assessing a security’s price movement and identifying potential trends and reversals. They are typically bounded between 0 and 100, offering insights into overbought or oversold conditions. One such indicator is the Moving Average Convergence Divergence (MACD), which utilizes moving averages to generate buy and sell signals. The Rate of Change (ROC) measures price percentage changes over a specific period, helping traders identify trend directions and potential reversals. The Stochastic Oscillator assesses overbought and oversold conditions, while the Relative Strength Index (RSI) evaluates recent price changes for similar purposes. These indicators serve as valuable tools for traders, offering diverse methods for interpreting price momentum and informing trading decisions.


