Welcome to a comprehensive exploration of RSI Divergence, a valuable tool for predicting market reversals. At 4xPip, where trading expertise meets innovation, our experts guide you through mastering this technique. Discover more at 4xpip, and contact us at [email protected] for personalized assistance.
Understanding RSI Divergence:
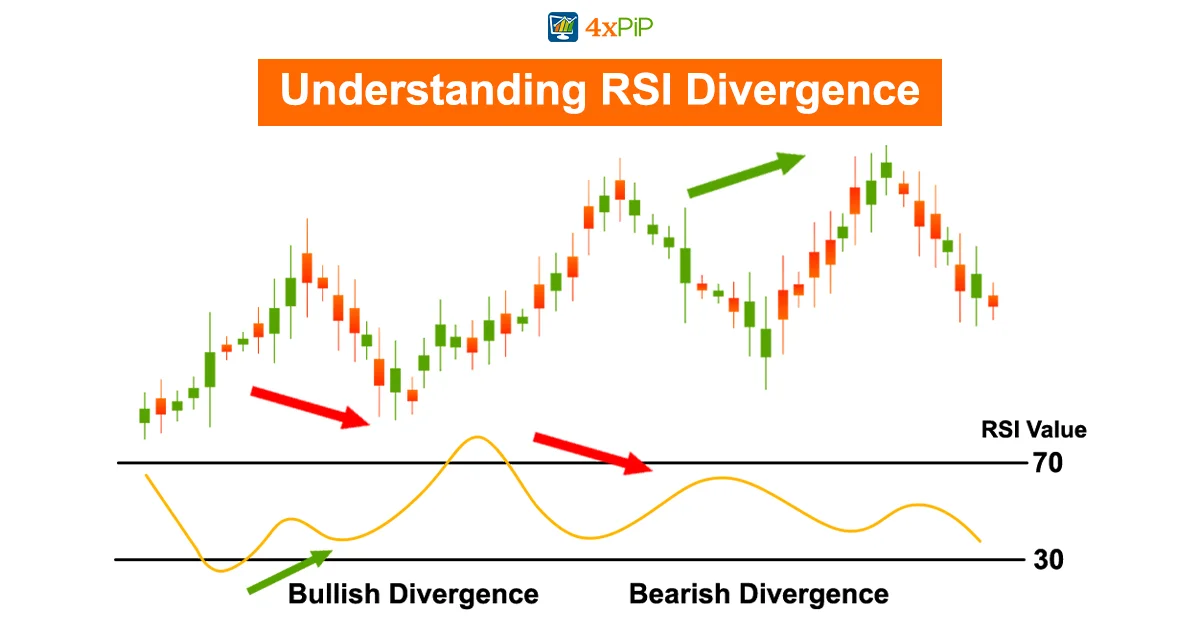
RSI Divergence works like an early alert system for traders, giving a heads-up about changes in how prices are moving before those changes show up on the price chart. It’s a bit like a signal saying, “Hey, something might be about to change in the market.” This early notice is like having a secret advantage in trading, helping traders make smarter decisions before the rest of the market catches on. It’s a tool that lets you see around corners in the market, offering a strategic edge for making more informed and timely trades.
Regular Divergence vs. Hidden Divergence:
Regular Divergence:
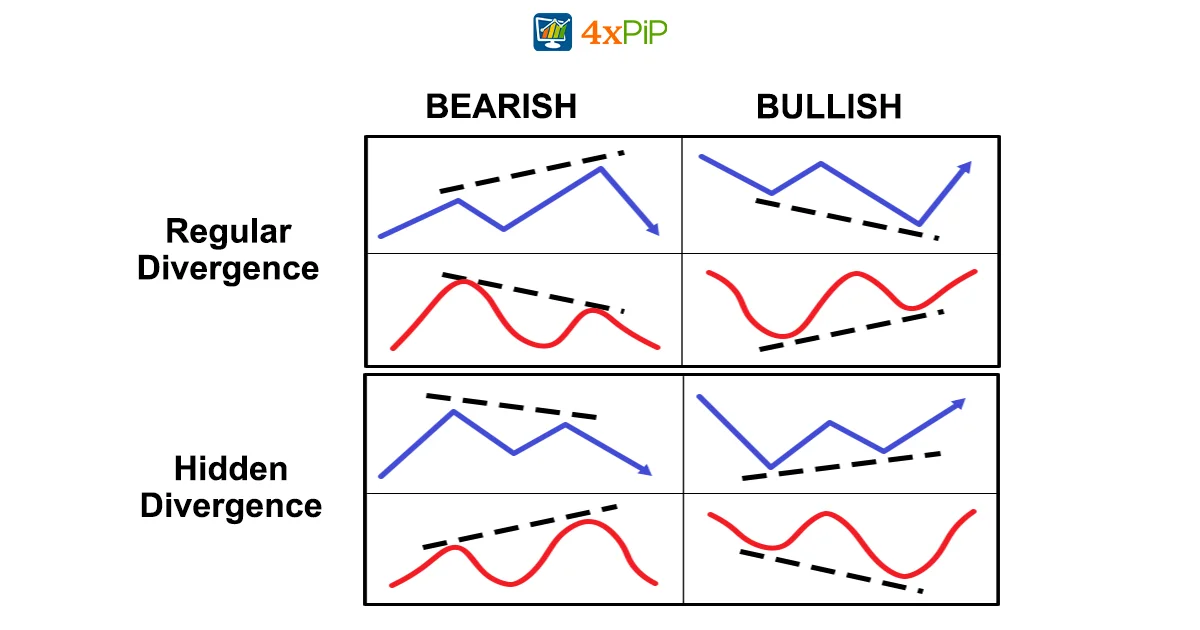
This divergence occurs when the RSI and price movement move in opposite directions. In a bearish regular divergence, prices create higher highs while RSI forms lower highs, signaling a potential reversal. Conversely, in a bullish regular divergence, lower lows in prices align with higher lows in RSI, indicating a potential upward shift.
Hidden Divergence:
Hidden divergence, a slightly different concept, happens when RSI and price movement move in the same direction. In a bearish hidden divergence, prices form lower lows while RSI forms higher lows, suggesting a continuation of the current trend. For a bullish hidden divergence, higher highs in prices pair with lower highs in RSI, indicating a potential extension of the existing upward trend.
Examples of Regular Divergence:
To visualize regular divergence, let’s explore charts depicting bearish and bullish scenarios.
Bearish Regular Divergence:
When price achieves two new highs, but RSI registers two new lows, it warns of a potential slowdown in upward momentum, signaling an imminent downward move.
Bullish Regular Divergence:
In a bullish setting, an oversold RSI pairs with a lower low in price and a higher low in RSI, signaling a potential upward movement.
Examples of Hidden Divergence:
Now, let’s unravel hidden divergence with practical examples.
Bearish Hidden Divergence:
As prices form lower lows, RSI displays higher lows, indicating a potential continuation of the current downward trend.
Bullish Hidden Divergence:
In a bullish hidden divergence, higher highs in prices pair with lower highs in RSI, suggesting a potential extension of the ongoing upward trend.
Conclusion:
Mastering both regular and hidden divergence adds depth to your trading toolkit. While regular divergence signals potential reversals, hidden divergence helps identify trend continuation. At 4xPip, we emphasize not only understanding these concepts but also integrating them into a comprehensive trading strategy. Explore our tools, and stay tuned for more insights into becoming a proficient RSI trader. For alerts on RSI divergence, use our indicator.