Bollinger Bands are a helpful tool for people who analyze the stock market. Additionally, created by John Bollinger in the 1980s, they have three main parts: a simple moving average (SMA). Moreover, the SMA is like a baseline, and the upper and lower bands, which are calculated based on the SMA, create a range around the stock’s price to show how much it’s changing. At 4xpip, we’re here to help you navigate through tough times in trading. We provide useful advice and practical solutions to minimize losses. To learn more, contact our experts at [email protected].
The Mathematics Behind Bollinger Band:
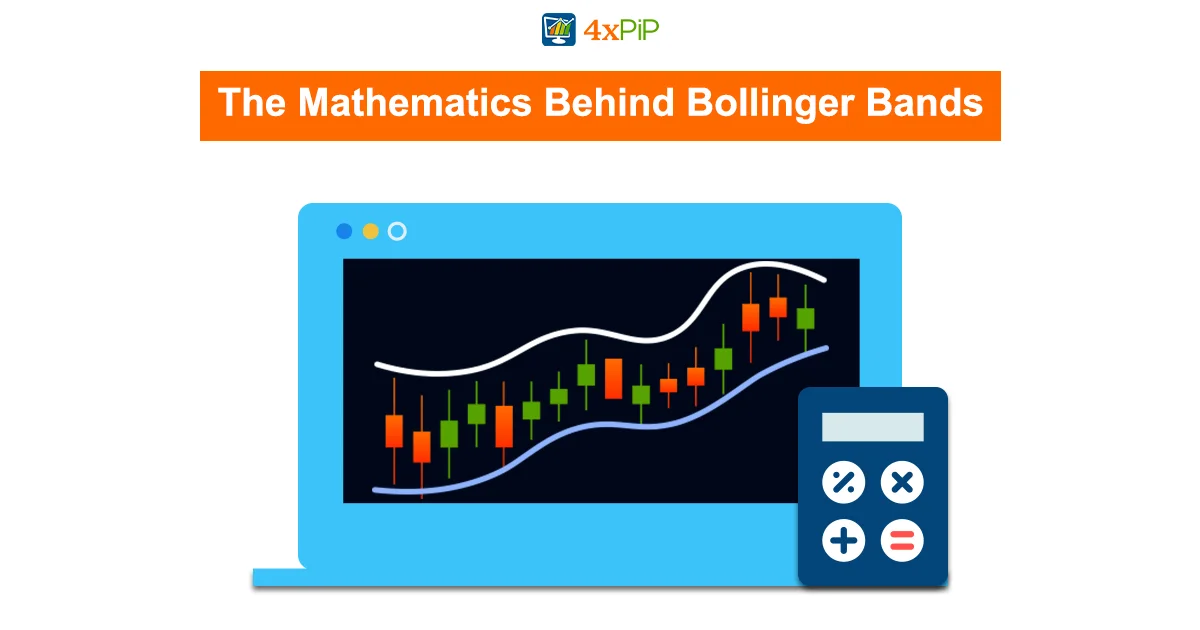
Understanding Bollinger Bands involves looking at the math that makes it work. First, you find the SMA (Simple Moving Average) of a security, usually over 20 days. Additionally, figure out the standard deviation of the security’s price. Standard deviation is a way to see how much the numbers vary from their average. Moreover, multiply the standard deviation by two, and add and subtract that value from each point on the SMA; then, you get the upper and lower bands. This math helps traders really understand how Bollinger Bands work.
Key Points about Bollinger Band Formula:
Knowing what each term means in the Bollinger Bands formula is crucial. The Upper Bollinger Band (BOLU), Lower Bollinger Band (BOLD), Moving Average (MA), Typical Price (TP), Number of Days in Smoothing Period (n), Number of Standard Deviations (m), and Standard Deviation over Last n Periods of TP (σ[TP,n]) all play a role in helping traders spot potential signals of the market being overbought or oversold. Understanding these terms is essential for interpreting Bollinger Bands and making smart trading choices.
Bollinger Bands in Action:
To use them, you draw a line called SMA and add upper and lower bands based on a set number of standard deviations from SMA. These bands act as dynamic thresholds, indicating if a stock is potentially overbought or oversold when its price hits them. Recognizing these signals is important for deciding when to buy or sell stocks. Bollinger Bands help traders visually and quantifiably assess a stock’s strength or weakness in a specific time frame, aiding strategic decision-making.
Practical Application of Bollinger Band:
Moving from theory to practice, this part helps traders use Bollinger Bands in their daily trades. To set up the bands, you need a 20-day simple moving average and pay attention when prices touch the upper or lower bands. It’s crucial to adjust strategies for different timeframes because Bollinger Bands work differently based on the timeframe you choose. These practical tips help traders make better decisions using Bollinger Bands.
Understanding Bollinger Band Dynamics:
Bollinger Bands show how much a stock’s price can change. When the bands widen, it means the stock is more volatile, and when they contract, it’s less volatile. This helps traders predict and handle changes in the market. Additionally, the bandwidth is crucial for understanding volatility, and helping traders deal with market ups and downs. Furthermore, we’ll look at examples to see how Bollinger Bands adapt to market conditions, giving traders a clear view of volatility changes.
Limitations and Considerations:
Bollinger Bands are useful tools for traders, but they have limitations. It’s important to know that they react to changes in prices instead of predicting them. Understanding these limitations helps traders use Bollinger Bands wisely; additionally, they should consider them as part of a larger set of tools for analysis.
Advantages of Bollinger Band:
Even though they have some drawbacks, Bollinger Bands are useful in technical analysis. They’re simple to understand visually and can help spot short-term price changes and when to buy or sell. Traders can use these benefits to improve their decision-making. Additionally, it’s emphasized that combining Bollinger Bands with other analysis methods, such as technical and fundamental analysis, is crucial for a well-rounded trading approach.
Applying Bollinger Bands for Day Trading:
Day traders use Bollinger Bands as a helpful tool. This guide shows how to use them well. By figuring out if an asset is getting stronger or weaker, day traders can make smart choices in both up and down trends. Real-life examples show how Bollinger Bands are crucial for day traders dealing with quick price changes. Additionally, this guide gives day traders practical tips on using Bollinger Bands in their strategies.
Bollinger Bands as a Volatility Indicator and Momentum Oscillator:
Bollinger Bands do two things: show if the market is calm or active and if prices are likely to change. They’re useful for short or long-term trading and can be used with various investments. This part explains how Bollinger Bands help traders know when to buy or sell, and where to set limits to minimize losses or take profits. Understanding how Bollinger Bands work in measuring market activity and predicting price changes helps traders make better decisions in different trading situations.
Integration with Other Technical Indicators and Fundamental Analysis:
To understand Bollinger Bands better, traders should see how they work with other indicators and tools. Additionally, exploring the Relative Strength Index (RSI) and the BandWidth indicator is crucial. This part explains how using these tools together can help traders get a more precise idea of what’s happening in the market. It highlights the need for a thorough analysis to make the most of Bollinger Bands when combined with other tools.
Using Bollinger Bands with MT4 and MT5 Expert Advisors:
In automated trading, the MT4 Bollinger Bands EA and MT5 Bollinger Bands EA are strong tools. They use Bollinger Bands to make precise buy and sell trades. The MT4 Bollinger Bands EA works on MetaTrader 4, and the MT5 Bollinger Bands EA works on MetaTrader 5.
Traders have different ways to finish trades; additionally, they can use trailing stop loss, break-even points, or closing part of the trade. Moreover, they can change the stop-loss and take-profit settings to manage risks better. Furthermore, closing part of the trade at the middle Bollinger Band ensures they get some profit; then, the rest is closed at the opposite band. Additionally, trailing stop-loss helps to get the most profit by choosing the best time to exit.
MT4 Bollinger Bands EA:
MT5 Bollinger Bands EA:
Traders can set up the Bollinger Bands the way they want, adjusting things like period, shift, deviation, and applied price. The Expert Advisors send alerts to keep traders updated through mobile, email, or MetaTrader desktop. These EAs work well in the live market, on all charts and pairs. Traders can test them using backtesting and optimization, adjusting settings for the best performance. This adaptability makes sure they get consistent results even when the market changes.
Summary:
Explore the world of Bollinger Bands with this comprehensive guide. Gain insights into the mathematical foundation behind Bollinger Bands, understand key formula components, and witness practical applications for day trading. Delve into the dynamics of Bollinger Bands as a volatility indicator and momentum oscillator, and learn how to integrate them with other technical indicators and fundamental analysis. Discover the advantages and limitations of Bollinger Bands, and explore their use in automated trading with the MT4 Bollinger Bands EA and MT5 Bollinger Bands EA. At 4xpip, we’re here to help you navigate tough times in trading. We provide useful tips and real solutions to lessen the impact of losses. If you want to learn more, contact our experts at [email protected].