This article explains Bollinger Bands in a simple way to help traders. Get useful information and advice from 4xPip’s experts. Visit 4xpip.com to find trading indicators, including auto-trading robots. For help, contact customer support at [email protected]. Improve your trading with 4xPip – your go-to platform for navigating the trading world.
Bollinger Bands, a favored indicator in financial markets, stand out among technical indicators, applicable to stocks, indices, and Forex. Developed by renowned trader John Bollinger, the dynamic nature of this indicator sets it apart, adjusting to market shifts and gauging momentum and volatility.
Understanding Bollinger Bands:
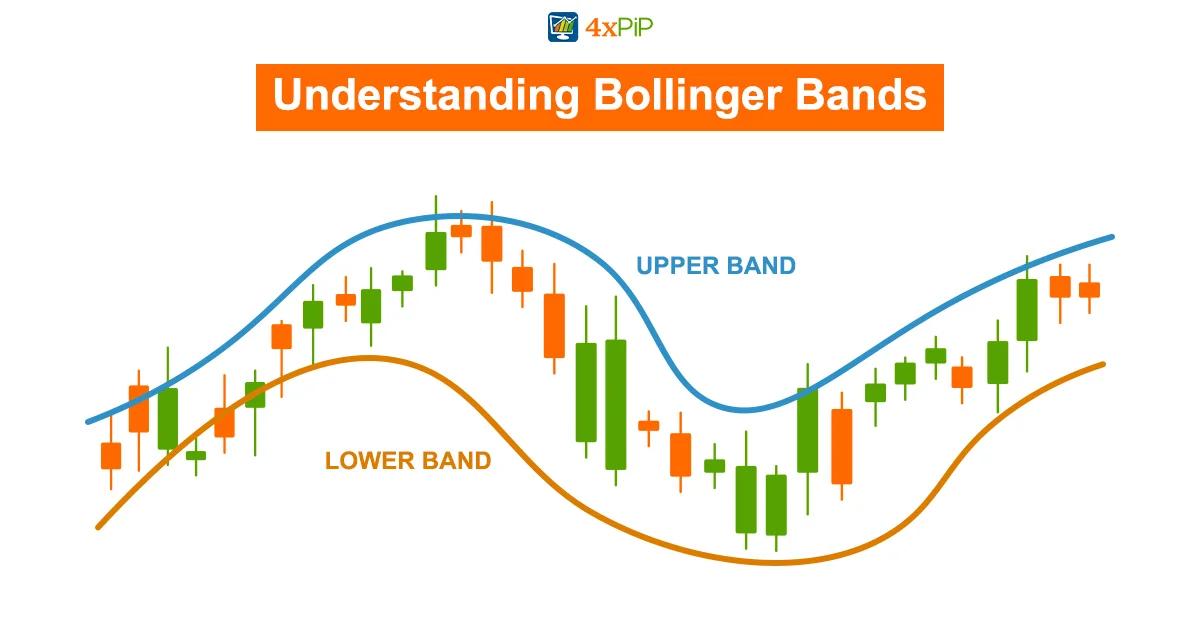
Bollinger Bands are useful for understanding how strong a trend is, confirming its direction, warning about potential breakouts, identifying consolidation periods, and finding local highs and lows. Unlike some other indicators, Bollinger Bands change based on current market conditions.
Components of Bollinger Bands:
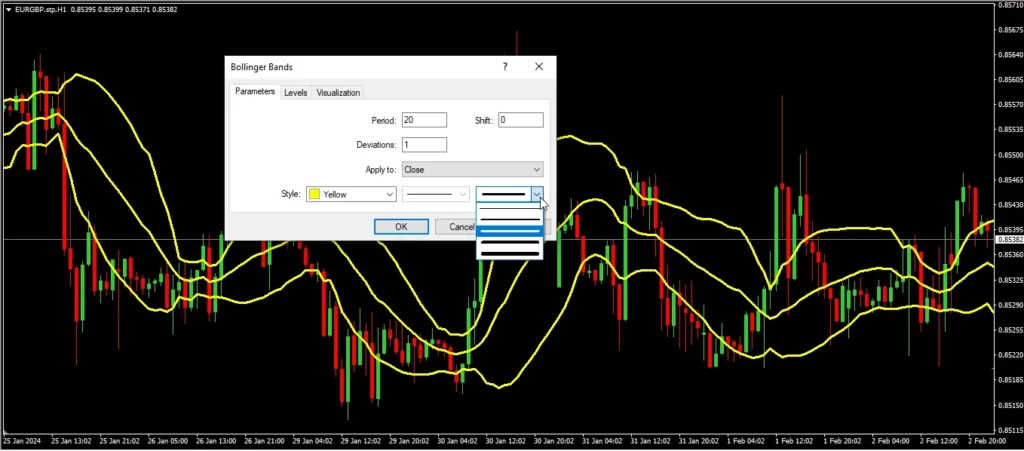
The indicator comprises three moving averages – upper band (20-day SMA plus double standard price deviation), middle band (20-day SMA), and lower band (20-day SMA minus double standard price deviation). Increasing distance between upper and lower bands during growing volatility suggests a trending price, while decreasing volatility indicates a sideways price movement.
Using Bollinger Bands in Trading:
When the price goes above the middle line on the Bollinger Bands, it’s a signal for traders to think about buying or selling. If it goes up, it might be a good time to buy, and if it goes down, it could be a good time to sell. This adds a practical side to the Bollinger Bands, helping traders make smart moves in the market. To make these signals more reliable, traders often check other indicators like RSI, ADX, or MACD. By looking at all these indicators together, traders can decide when to buy or sell based on what’s happening in the market.
Bollinger Bands Trading Strategy:
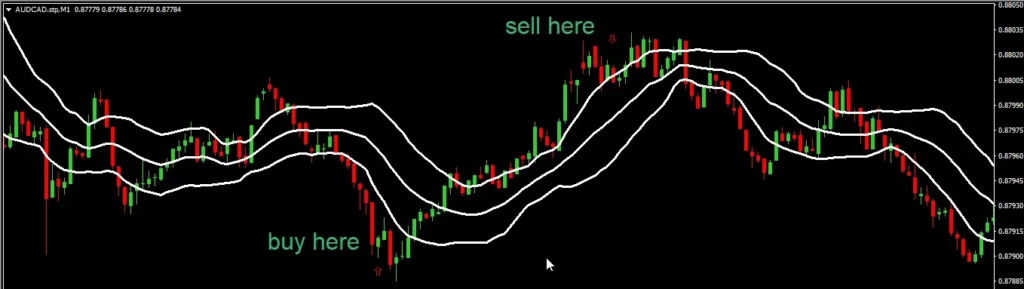
The Bollinger Bands trading strategy helps traders take advantage of market conditions. One way is by looking at the upper band – when prices touch it, it might mean they’re too high, and traders could sell. On the flip side, if prices touch the lower band, suggesting they’re too low, traders might think about buying. This strategy lets traders use different approaches based on what Bollinger Bands show, helping them make decisions in the changing world of financial markets. By using various strategies, traders can adapt to different market situations, making the most of opportunities and handling risks wisely.
Calculation of Bollinger Bands:
The middle line of the Bollinger Bands is just the average price over the last 20 days. It’s like a baseline for the indicator. The upper band is found by adding two standard deviations to the middle line, and the lower band is found by subtracting two standard deviations from the middle line. These upper and lower bands give us a range around the average price, helping us see possible extreme prices and how much prices might change.
Putting Bollinger Bands into Action:
Bollinger Bands are a useful tool for traders in the fast-changing world of finance. They show how volatile the market is in real-time and help traders see trends and potential changes in direction. These bands are flexible and can adapt to price shifts, giving traders a heads-up on what might happen next. Understanding Bollinger Bands is key for making smart decisions in trading. Our guide explains how these bands work and how to use them effectively. It covers things like interpreting the distance between upper and lower bands and spotting overbought or oversold conditions. By reading our guide, traders can improve their skills and become better at analyzing the market.
MT4 Bollinger Bands:
DOWNLOAD NOWConclusion:
Bollinger Bands help traders understand the market better, making it easier to make decisions in the constantly changing financial world. Use this useful tool to improve your trading strategies with 4xPip.
FAQs
What are Bollinger Bands and why are they popular among traders?
Bollinger Bands are dynamic indicators designed by John Bollinger, favored for their adaptability to market shifts.
How do Bollinger Bands differ from other static indicators?
Unlike static indicators, Bollinger Bands adjust to new market conditions, reflecting recent price actions and measuring momentum.
What key information can traders gather from Bollinger Bands?
Traders can analyze trend strength, direction confirmation, potential breakouts, and consolidation periods, and pinpoint local highs and lows.
How is the Bollinger Bands indicator utilized in trading strategies?
The indicator aids traders in identifying potential buying or selling opportunities when the price crosses the middle line.
What is the significance of the increasing distance between upper and lower bands?
A growing distance signals increased volatility, suggesting a trending price, while a narrowing gap indicates potential sideways movement.
How does the Bollinger Bands trading strategy capitalize on market conditions?
The strategy targets overbought or oversold conditions, signaling potential sell opportunities when prices touch the upper band and buy opportunities when touching the lower band.
Can Bollinger Bands be used in conjunction with other indicators for confirmation?
Yes, for enhanced reliability, traders often confirm Bollinger Bands signals with other indicators like RSI, ADX, or MACD.
What is the core calculation for Bollinger Bands, and how are upper and lower lines determined?
The middle line is a 20-day simple moving average, with upper and lower lines calculated by adding or subtracting standard deviations.
How can traders practically apply Bollinger Bands in their day-to-day activities?
Bollinger Bands serve as a dynamic tool for traders to navigate the market effectively, offering practical insights into trends.
Where can traders find more comprehensive guidance on Bollinger Bands and trading indicators?
Explore 4xPip’s educational guide for an in-depth understanding, and visit 4xpip.com for a range of trading indicators and expert advice.