Bollinger Bands, made by John Bollinger, are an important tool in technical analysis for traders. They help understand price changes and possible turning points. To use them well, you need to learn how they’re calculated, recognize when prices are too high or too low, think about other things affecting prices, and explore strategies like Bollinger Bounce and Squeeze. Picture enhancing its effectiveness with Expert Advisors designed for MetaTrader 4 and MetaTrader 5.
The Bollinger Band EA for MT4 and Bollinger Band EA for MT5 from 4xpip blend basic analysis with smart automation. These reliable Expert Advisors work with Bollinger Bands, adjusting to market changes. Their simple strategy is to buy low and sell high, using Bollinger Bands as a guide. This makes trading smoother and more automated. If you need assistance with Bollinger Bands, email us at [email protected] to talk to our experts.
Calculation of Bollinger Bands:
Bollinger Bands have three lines – middle, upper, and lower. They help analyze the market. The middle line is a 20-day average, showing average price. Upper and lower bands show volatility by adding and subtracting twice the daily standard deviation from the middle line. Traders can adjust the period (n) and standard deviations (m) based on their preferences. Knowing these parameters is crucial for using Bollinger Bands in trading strategies.
Calculating Bollinger Bands involves precision. Parameters affect how bands respond to price changes. Longer SMA periods capture longer trends, while shorter periods react faster to recent changes. Adjusting standard deviations changes band width, indicating market volatility. Understanding these parameters is key to grasping how Bollinger Bands show price dynamics.
Overbought and Oversold Strategy:
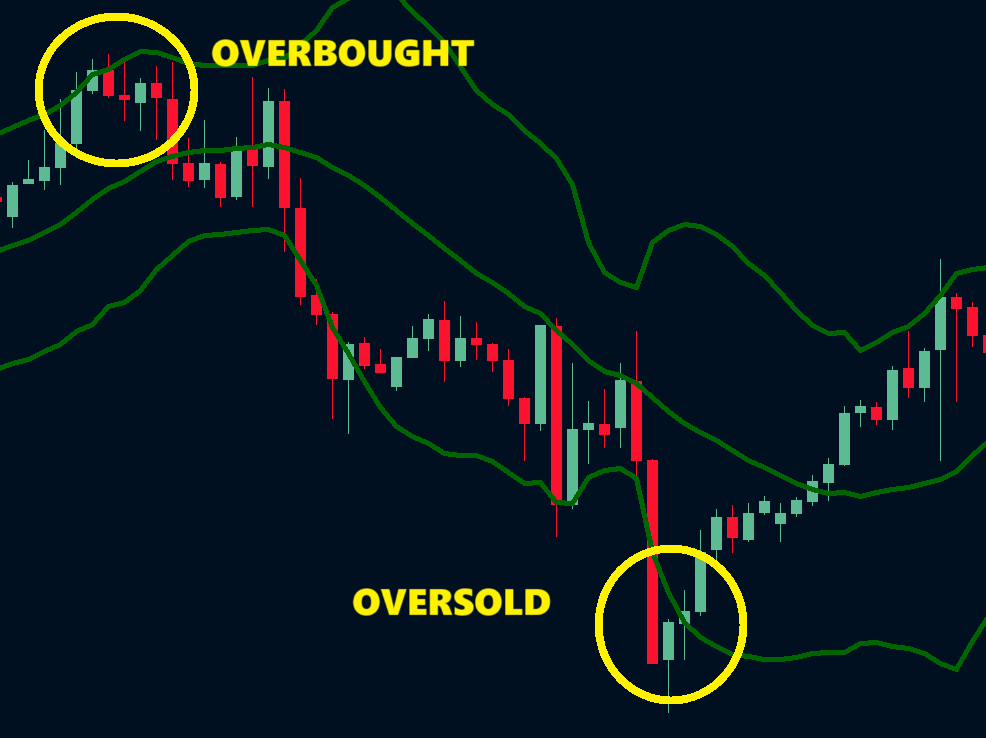
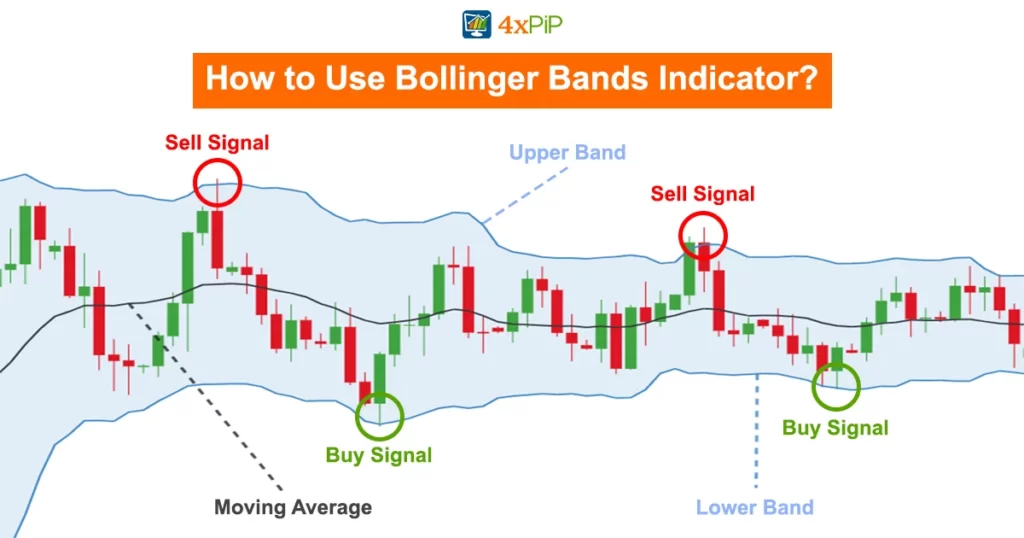
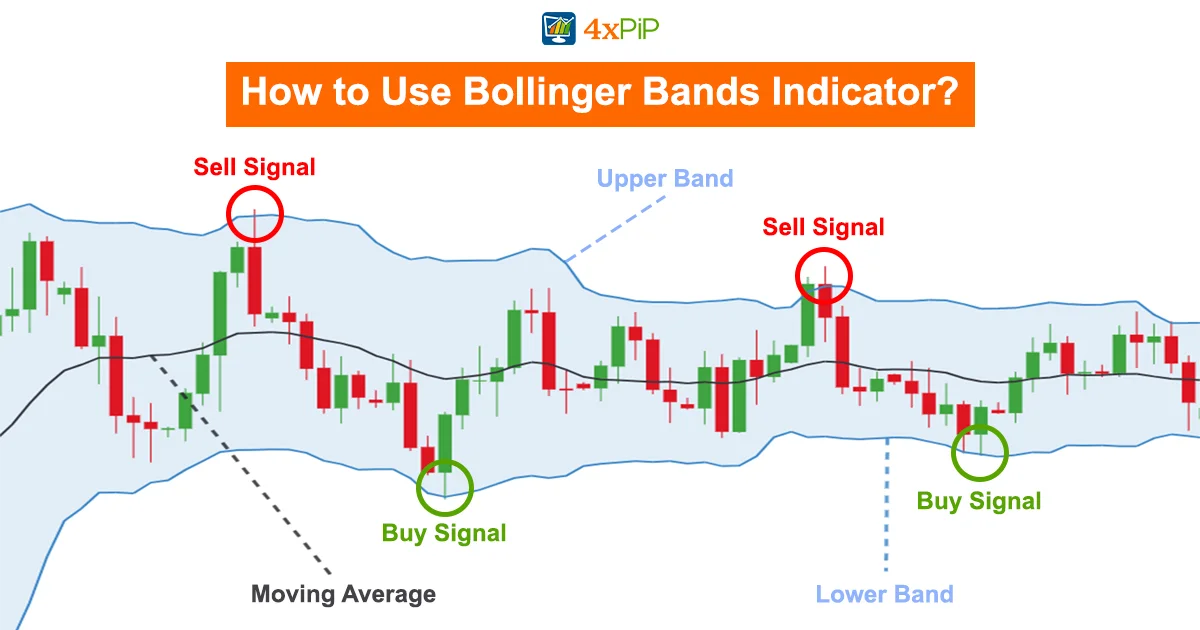
Understanding Bollinger Bands goes beyond just looking at lines on a chart. It’s about recognizing when prices are too high (overbought) or too low (oversold) in the market. If prices drop below the lower band, it suggests a possible buying opportunity because the market might have oversold, and a bounce-back is expected. On the other hand, if prices go above the upper band, it signals an overbought condition, hinting at a potential price drop.
This strategy relies on the idea that prices tend to go back to their average after big changes. Traders can use this overbought and oversold strategy to make decisions based on signals from Bollinger Band. By understanding the market conditions behind these signals, traders can adjust their strategies to take advantage of possible reversals or corrections.
To make the most of this strategy, traders should be careful and consider the overall market situation and other indicators. It’s important to be aware of false signals and confirm information from other sources before making trading decisions.
Additional Considerations:
Bollinger Bands help traders understand price movements, but it’s important to look at other things too. These band only focus on past prices. So, it’s smart to also use volume indicators, which show how much trading is happening. Combining both gives a better picture. However, don’t rely only on Bollinger Band. They’re not perfect for knowing exactly when to buy or sell. To be successful, traders should look at many factors and use different tools for smart decision-making.
Bollinger Band works well with volume indicators. Volume tells us how strong price movements are. If Bollinger Bands and high trading volumes agree, it makes the analysis more reliable. Remember, no tool is foolproof. So, use Bollinger Band along with other tools, considering the overall market situation, news, and other indicators. Stay updated on market changes, economic events, and volatility. Adjust your strategies as needed.
In finance, it’s important to be adaptable and precise. The Bollinger Band EA for MT4 and Bollinger Band EA for MT5 is a trustworthy tool to help you with that. When using different Bollinger Band strategies, think about adding this tool to improve your trading. Take advantage of the promotion to boost your trading potential. Check out the Bollinger Band EA for MT4 and Bollinger Band EA for MT5 to enhance your trading precision.
Bollinger Band EA for MT4:
DOWNLOAD NOWBollinger Band EA for MT5:
DOWNLOAD NOWBollinger Bounce and Squeeze Strategies:
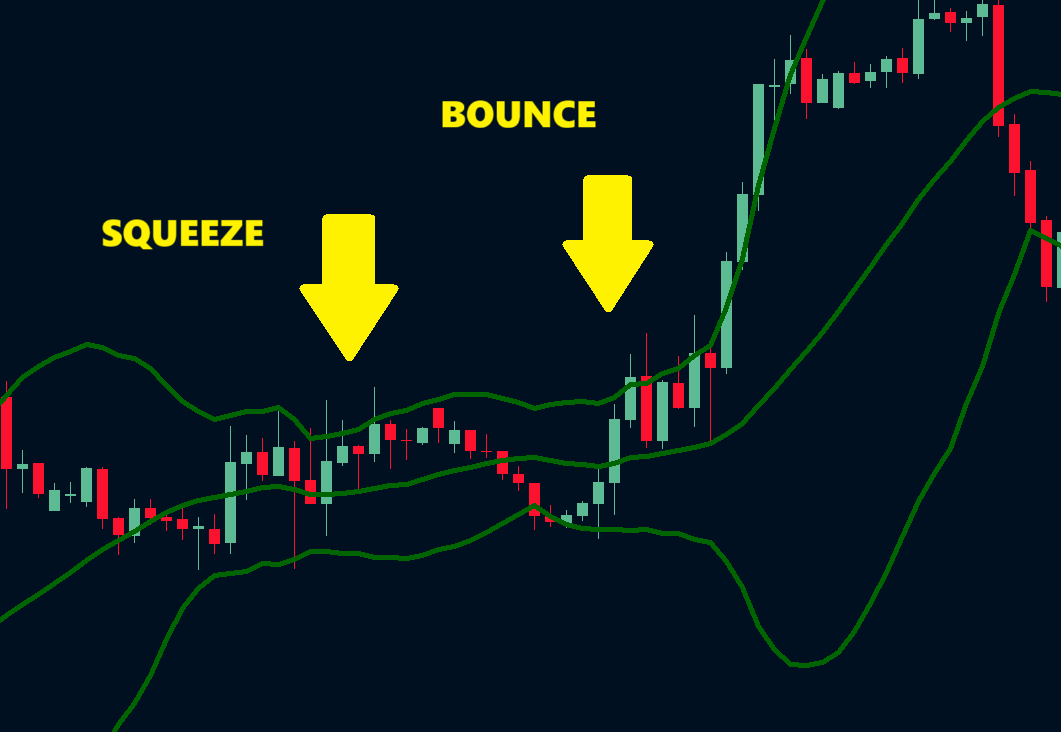
Bollinger Bands help traders with two strategies: the Bollinger Bounce and the Bollinger Squeeze. The Bollinger Bounce relies on prices bouncing back to the middle of the bands, acting like support and resistance. Traders use this when the market is moving sideways without a clear trend. Pay attention to the bandwidth and avoid it when the bands are expanding, indicating a trend.
The Bollinger Squeeze is about the bands getting closer, suggesting a potential breakout. Traders using this strategy want to catch the move early in the breakout direction. It works well when the market has low volatility before significant price changes. This setup doesn’t happen every day, but it offers good chances a few times a week, especially in shorter time frames. To use these strategies, traders need to understand market conditions and adapt to different situations. Choosing the right strategy depends on what the market is doing.
Purpose of Inputs in Detail:
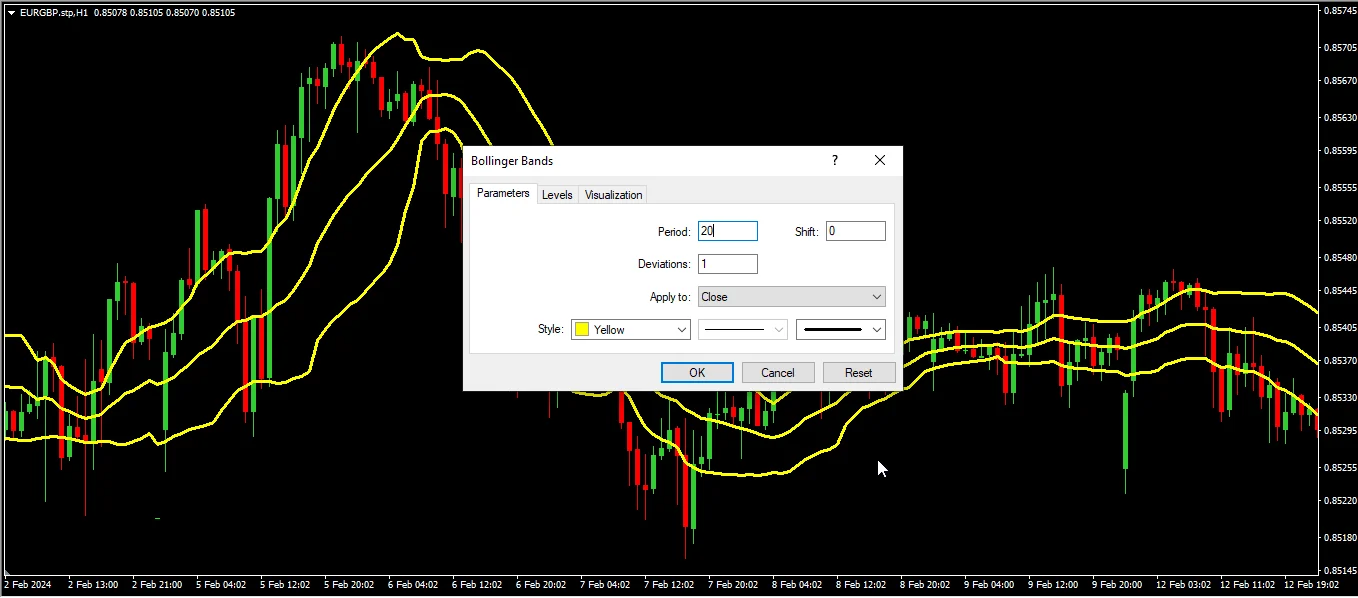
To make the most of Bollinger Bands, traders should understand the key elements. The “period” (n) is the number of days used to calculate the average price, with a default of 20 days. Traders can adjust this based on their preferences and the assets they’re trading. This average price is the middle band in Bollinger Bands, giving a reference point for price movements.
“Standard Deviations” (m) determine the width of the bands, showing market volatility. Bollinger Band use two standard deviations, with the default at 2. Traders can change this to match their risk tolerance. Wider bands mean higher volatility, while narrower bands suggest lower volatility. Knowing how standard deviations affect band width is crucial for predicting price breakouts or consolidations.
The Moving Average (MA), Upper Bollinger Band (BOLU), Lower Bollinger Band (BOLD), and Standard Deviation (σ) together make up the Bollinger Bands formula. The MA smoothens price fluctuations and acts as a central reference line. BOLU and BOLD set upper and lower boundaries, giving insights into overbought or oversold conditions. Standard Deviation (σ) defines the bands’ width, offering information on market volatility. Understanding these inputs helps customize Bollinger Bands for specific trading goals.
Volatility Measurement and Trend Reversals:
Bollinger Bands help traders understand how much the market is moving. Additionally, if the bands are wide, it means the market is more volatile, indicating a higher chance of big price changes. Traders use this info to guess if prices will break out or stay in a range. Moreover, knowing how much the market is moving helps with deciding how much to invest, managing risks, and choosing trading strategies.
Bollinger Band also show possible changes in the market trend. If prices go outside the bands and then come back in, it might mean the trend is reversing. This makes them useful for strategies that follow trends or predict reversals. Traders should pay attention to how prices move in relation to the bands and look for confirmation signals to spot potential trend changes.
Tips for Effective Bollinger Bands Usage:
Bollinger Bands are useful for understanding the market, but it’s important to use them wisely. Relying solely on them for trading is risky. To make better decisions, consider other info like fundamental analysis, economic indicators, and overall market trends. Don’t just focus on Bollinger Bands alone. Combine Bollinger Bands with other indicators like moving averages or trendlines to be sure about the market trend. Don’t just trust Bollinger Bands without looking at the bigger market picture.
To get more out of Bollinger Band, explore strategies beyond basic signals. For instance, look for double bottoms or watch for breakouts. Try different settings and strategies based on what you’re trading and the market conditions.
Keep learning and adapting. Markets change, so should your strategies. Stay updated on market dynamics, economic events, and volatility. Regularly adjust your strategies to match the market. By combining technical analysis with a broad market approach, Bollinger Band can be a reliable tool. Keeping track of market changes and adjusting your strategies is crucial. The Bollinger Band EA for MT4 and Bollinger Band EA for MT5 are useful Expert Advisors that change with changing market conditions. Stay flexible and adapt your strategies using this versatile tool.
Summary:
Bollinger Bands are a useful tool for traders. They help you figure out when prices might change or hit a turning point. Traders use a 20-day average and standard deviations to see if prices are too high or too low. This helps them make smart decisions. There are strategies like Bollinger Bounce and Squeeze that give even more insights. If you want to make trading smoother and more automated, you can use the Bollinger Band EA for MT4 and Bollinger Band EA for MT5 from 4xpip. It combines basic analysis with automation. You can learn more on the 4xpip website and contact them at [email protected] if you have questions.
FAQ’s
What are Bollinger Bands and how are they calculated?
Bollinger Bands consist of three lines – middle, upper, and lower. The middle line is a 20-day average, while the upper and lower bands show volatility by adding and subtracting twice the daily standard deviation from the middle line.
How do Bollinger Bands help identify overbought and oversold conditions?
If prices drop below the lower band, it suggests a potential buying opportunity as the market may have oversold. Conversely, prices above the upper band indicate an overbought condition, hinting at a potential price drop.
What strategies can be implemented with Bollinger Bands?
Two common strategies are the Bollinger Bounce; additionally, the prices may bounce back to the middle of the bands. Another approach is the Bollinger Squeeze, indicating a potential breakout. Moreover, traders should adapt strategies based on market conditions.
What is the purpose of the Bollinger Band EA for MT4 and Bollinger Band EA for MT5 by 4xpip?
The Expert Advisors blend basic analysis with smart automation; additionally, they guide traders to buy low and sell high using Bollinger Bands as a reference. Moreover, they adjust to market changes, providing a reliable tool for smoother and more automated trading.
How do traders adjust Bollinger Bands parameters for their preferences?
Traders can adjust the period (n) and standard deviations (m) based on their preferences. Longer SMA periods capture longer trends, while adjusting standard deviations changes band width, indicating market volatility.
How can Bollinger Bands be combined with other indicators for better analysis?
Bollinger Bands work well with volume indicators, providing a more comprehensive view. Additionally, combining both can enhance the reliability of the analysis, considering the strength of price movements.
What role do standard deviations play in the width of Bollinger Bands?
Standard deviations (m), additionally, determine the width of the bands, showcasing market volatility. Traders can customize this parameter based on their risk tolerance; moreover, wider bands indicate higher volatility, while narrower bands suggest lower volatility.
How do Bollinger Bands assist in measuring market volatility and predicting trends?
Wider bands indicate higher market volatility, suggesting a higher chance of significant price changes. Additionally, Bollinger Bands can signal possible changes in the market trend when prices move outside and then back inside the bands.
Can Bollinger Bands be relied upon as the sole tool for trading decisions?
Relying solely on Bollinger Bands is risky. To make better decisions, it’s important to consider other information like fundamental analysis, economic indicators, and overall market trends.
How can traders maximize the effectiveness of Bollinger Bands?
To get more out of Bollinger Bands, traders are encouraged to explore strategies beyond basic signals. Additionally, they should look for double bottoms, watch for breakouts, and regularly adjust their strategies to match changing market dynamics. Keeping track of market changes and adapting strategies is crucial for success.