Bollinger Bands, made by John Bollinger in the 1980s, are essential in technical analysis. They help traders see the market better. In the unpredictable financial world, traders must grasp how Bollinger Bands work to stay ahead. Along the way, you’ll learn about helpers called the MT4 EA Bollinger Band and MT5 Bollinger Band EA that can make your trading easier. First, let’s talk about the useful tools and Expert Advisors provided by us at 4xPip. If you want help improving your trading strategies, you can contact them at [email protected].
Understanding Bollinger Bands:
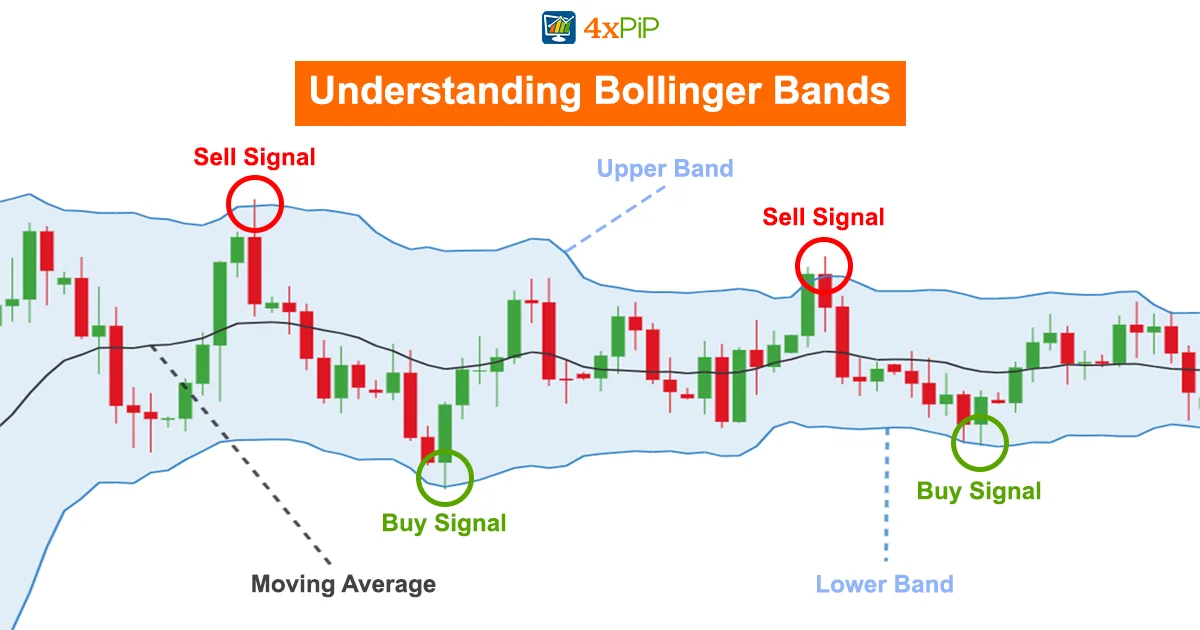
Bollinger Bands have three main lines on a price chart: the Upper Band; additionally, the Middle Band (Simple Moving Average or SMA); and the Lower Band. Moreover, these bands help traders see how the market is doing.
The Upper Band shows the highest price the security might reach and can act as a strong barrier. Furthermore, the Middle Band, based on the SMA, gives an average price over a set time, usually 20 days. Then, the Lower Band represents the lowest price and signals potential buying opportunities when prices are too low.
How Bollinger Bands Work:
Bollinger Bands change based on how the market is doing. They get wider when the market is more up and down, and narrower when it’s calmer. Traders find this helpful to figure out when to buy or sell.
Traders need to understand the market’s patterns. When the bands get narrow, it means the market is not very active, and traders can expect things to pick up soon. On the other hand, if the bands get wider, it means the market is active, and there may be good chances for traders to make moves.
Significance of Bollinger Bands:
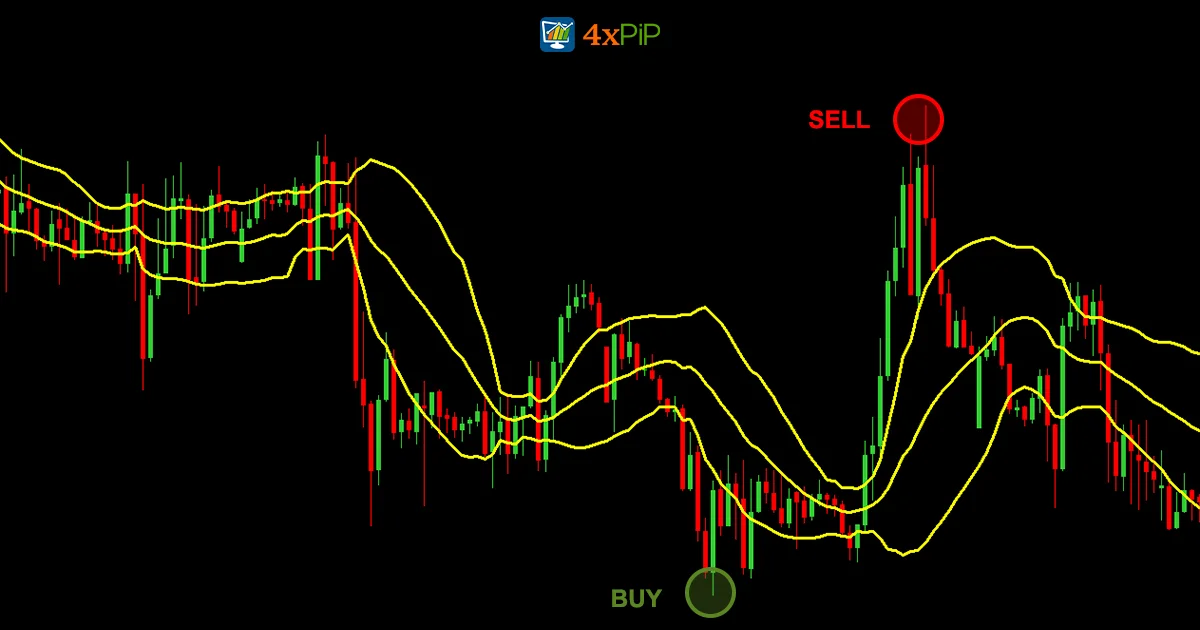
Bollinger Bands are super useful in trading because they help us figure out when to buy or sell, predict when a trend might change, and handle the ups and downs in the financial markets. Traders can use them in many different situations. The bands help us see how much prices change, find good times to trade, and give us hints about when a trend might turn around. They’re really important for traders, especially when the market gets tricky.
Formula for Bollinger Bands
To figure out Bollinger Bands, you mainly need two things: the Middle Band (SMA) and two standard deviations. Traders can customize the bands for their strategies by changing the period for the moving average.
To use Bollinger Bands, you follow a simple process. Choose a period for the moving average, usually 20 days. Then, calculate the SMA add two standard deviations to get the Upper Band, and subtract two standard deviations to get the Lower Band. This calculated setup helps traders make informed decisions using the bands.
Using Bollinger Bands in Technical Analysis:
Bollinger Bands do three important things in technical analysis: show trends; additionally, they highlight overbought or oversold situations, and indicate possible support and resistance levels. This helps traders make better decisions at the right time. If prices stay above the Middle Band, it suggests an uptrend; moreover, if they consistently stay below, it indicates a downtrend. This information is crucial for traders aligning their strategies with the current market direction.
Reading a Bollinger Band Chart:
Understanding a Bollinger Band chart involves six simple steps. First, find the Middle Band. Then, pay attention to the width of the bands. If they’re narrow, it means low volatility, which might lead to a breakout or trend reversal. On the other hand, wide bands signal high volatility, indicating possible momentum in the market. By watching how the width and price action interact, traders can make better decisions about the market.
Utilizing Bollinger Bands for Day Trading:
Day traders use Bollinger Bands in five main ways for effective day trading. These include checking how much prices vary, confirming if a trend is happening, figuring out when to enter a trade, deciding on target prices, and looking at different timeframes.
For day traders, it’s crucial to know about volatility; additionally, understanding how much prices go up and down is essential. Narrow bands mean low volatility; moreover, wide bands indicate high volatility. Traders use this information to plan for breakouts or be ready for trends to change.
Best Bollinger Bands Trading Strategies:
Let’s explore five simple and effective trading strategies using Bollinger Bands. Additionally, these strategies include the Bollinger Band Squeeze, Reversals, Double Bottoms, Riding the Bands, and Middle Bands. Moreover, they provide traders with a versatile set of tools that can be used in different trading situations.
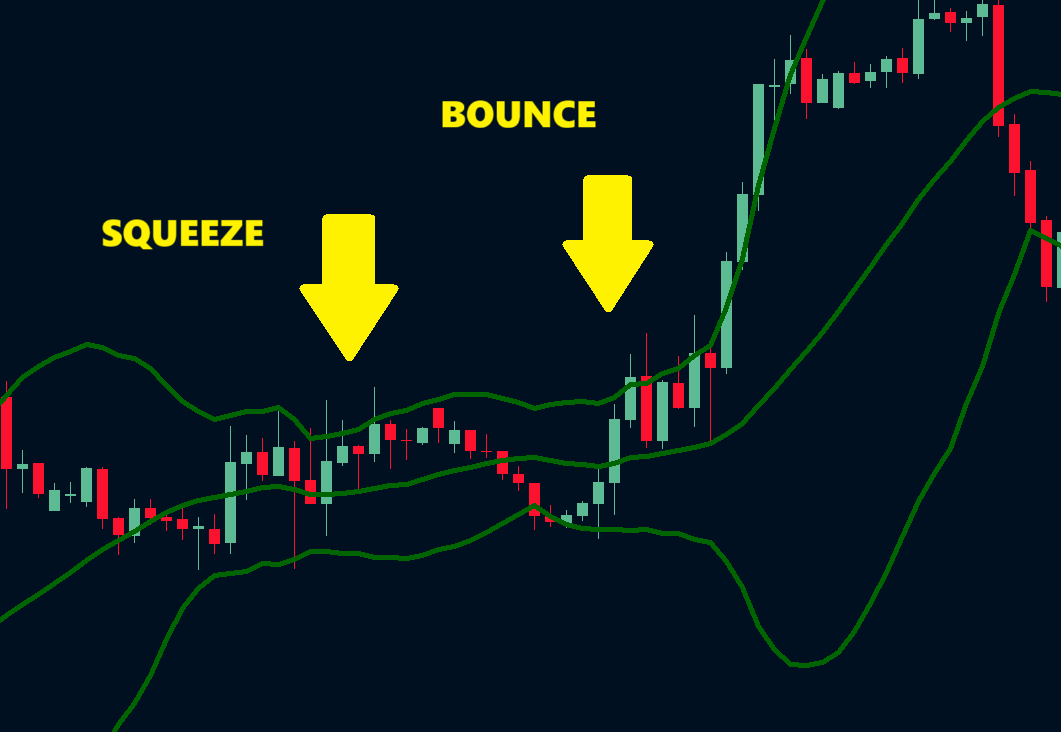
For example, the Bollinger Band Squeeze happens when the bands get close together, showing low volatility and a potential upcoming price change. Traders use this signal to prepare for possible trend reversals. On the other hand, riding the Bands strategy involves entering a trade when the price touches the upper or lower Bollinger Band and exiting when it goes back to the Middle Band. It’s a systematic approach that goes along with the market’s natural rhythm.
Advantages of Bollinger Bands:
Bollinger Bands are useful for knowing when to buy or sell, showing how prices change, recognizing trends, and guiding traders in various market situations. They visually represent market volatility by getting wider or narrower. This helps traders predict significant moves or corrections, allowing them to adjust their plans. The MT4 EA Bollinger Band and MT5 Bollinger Band EA from 4xpip include all these features, making them the best choice for your Bollinger Band trading journey.
MT4 EA Bollinger Band:
MT5 EA Bollinger Band:
Other Technical Indicators besides RSI:
The Relative Strength Index (RSI) is a common tool for analyzing the market. Additionally, Bollinger Bands can be paired with others like Moving Averages Convergence Divergence (MACD) and Stochastic Oscillator for a more thorough analysis. Using multiple indicators gives a broader view of market conditions, and moreover, it enhances the overall understanding of the market.
These extra tools provide different insights into the market. For example, MACD looks at momentum, while the Stochastic Oscillator assesses overbought and oversold conditions. Combining these indicators with Bollinger Bands helps traders get a more detailed and accurate understanding of the market.
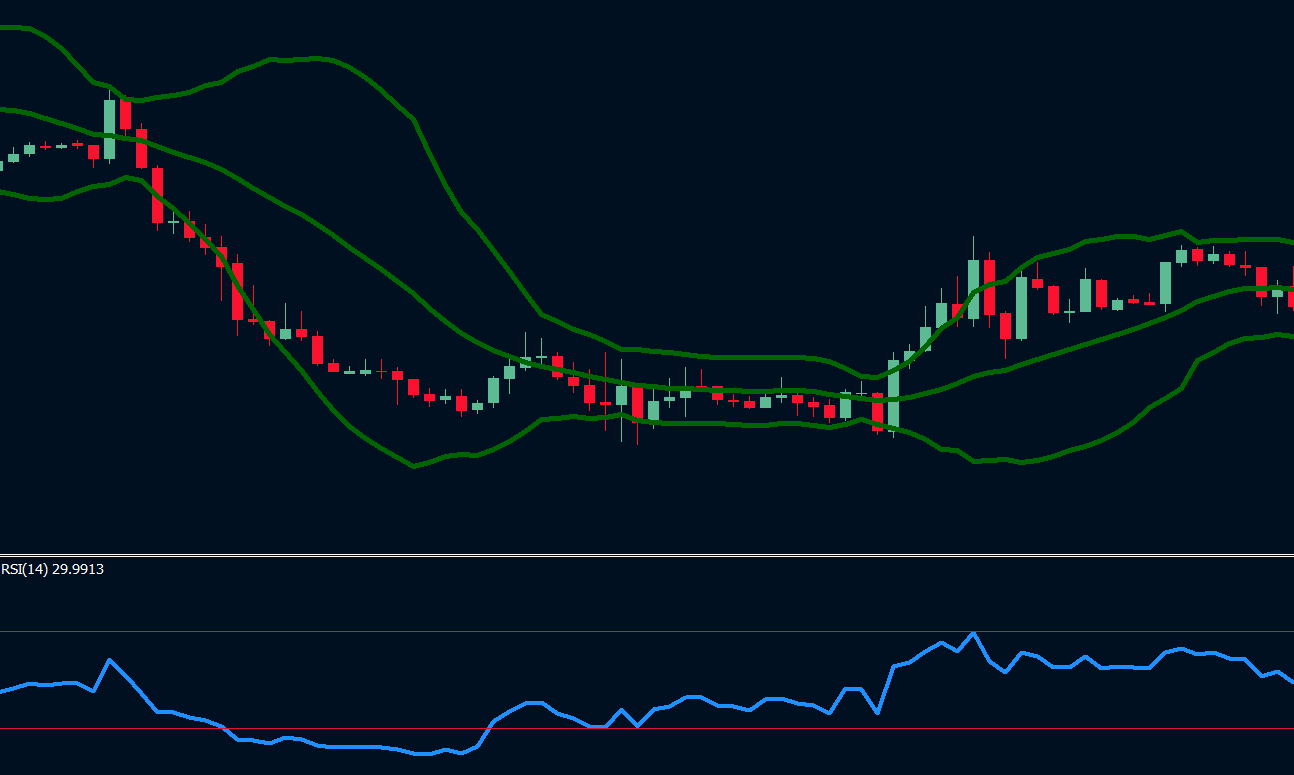
Example of Bollinger Bands:
There are automated helpers called the MT4 EA Bollinger Band and MT5 Bollinger Band EA. These are like smart assistants for traders. For example, automatically does trades for you based on Bollinger Bands. If the stock is low, it buys. If it’s high, it sells. This way, you can potentially make money without constantly watching the market.
The EA can close a part of your trade when it’s doing well to secure some profit. It can also adjust its strategy based on how the market is moving. And if it sends an alert to your phone or email whenever it makes a trade, so you always know what’s happening.
You can customize the Expert Advisor too. You can change settings like how long it looks back in time (Period), how much it allows for changes (Deviation), and more. This makes it flexible for different trading styles.
Also, it lets you test how it would have been done in the past (backtesting) and find the best settings. This helps you make smarter decisions based on data.
Summary:
Learn how Bollinger Bands work to improve your trading accuracy. Understand their formula, calculation, and practical uses. These indicators, including Upper, Middle (SMA), and Lower Bands, adjust to market conditions. They help identify trends, overbought or oversold situations, and support/resistance levels. Explore day trading strategies like the Bollinger Band Squeeze and Riding the Bands. Combine them with other indicators like MACD and Stochastic Oscillator for a thorough market analysis. Automated tools such as MT4 EA Bollinger Band and MT5 Bollinger Band EA provide hands-free trading, customizable for different styles, and allow backtesting for informed decisions. For more insights and optimization of your trading strategies, visit 4xpip‘s website or contact them at [email protected] for expert guidance.
FAQ’s
What are Bollinger Bands and how do they work?
Bollinger Bands are a technical analysis tool consisting of Upper, Middle (SMA), and Lower Bands. They adapt to market volatility, widening during active periods and narrowing during calm ones, aiding traders in making buy or sell decisions based on price movements.
How is the Middle Band (SMA) calculated in Bollinger Bands?
The Middle Band is derived from the Simple Moving Average (SMA) over a specified period, commonly 20 days. It provides an average price, serving as a reference point for assessing market trends.
What does a Bollinger Band Squeeze indicate?
A Bollinger Band Squeeze occurs when the bands narrow, signaling low volatility and a potential upcoming price change. Traders use this signal to prepare for possible trend reversals.
Can Bollinger Bands be used for day trading, and how?
Yes, day traders utilize Bollinger Bands to gauge price variability, confirm trends, time entry and exit points, determine target prices, and analyze different timeframes, providing valuable insights for effective day trading strategies.
What advantages do Bollinger Bands offer in trading?
Bollinger Bands not only show price fluctuations but also help recognize trends, highlight overbought or oversold situations, and indicate potential support and resistance levels. Their visual representation of volatility assists in predicting significant market moves.
How can Bollinger Bands be combined with other technical indicators for analysis?
Pairing Bollinger Bands with indicators like Moving Averages Convergence Divergence (MACD) and Stochastic Oscillator provides a more comprehensive view of market conditions. Each indicator contributes unique insights, enhancing the accuracy of market analysis.
What is the formula for calculating Bollinger Bands?
The formula involves the Middle Band (SMA) and two standard deviations. By adding two standard deviations, traders derive the Upper Band, and by subtracting two standard deviations, they obtain the Lower Band, offering a calculated setup for informed decision-making.
How do traders interpret Bollinger Bands on a chart?
Traders can interpret Bollinger Bands by observing the Middle Band, monitoring the width of the bands (narrow for low volatility, wide for high volatility), and analyzing the interaction between width and price action to make well-informed decisions about the market.
What role do Bollinger Bands play in trend identification?
If prices consistently stay above the Middle Band, it suggests an uptrend; if consistently below, it indicates a downtrend. This information is crucial for traders aligning their strategies with the current market direction.
How can automated tools like MT4 EA Bollinger Band and MT5 Bollinger Band EA assist traders?
Automated tools like MT4 EA Bollinger Band and MT5 Bollinger Band EA execute trades based on Bollinger Bands, offering a hands-free trading experience. Traders can customize settings, conduct backtesting, and receive alerts, enhancing their ability to adapt to market changes and make informed decisions.


