In the vast realm of trading, understanding the tools at your disposal is crucial. In this guide, 4xPip aims to demystify the Parabolic SAR, a tool designed to decipher asset price changes and market trends. Created by J. Welles Wilder Jr., also the mind behind the relative strength index (RSI), the Parabolic SAR, often referred to as the “stop and reversal system,” provides simplicity with a touch of complexity. 4xPip is here to break down its usage, nuances, and whether this user-friendly indicator can stand alone profitably.
Parabolic SAR – Decoding the Basics:
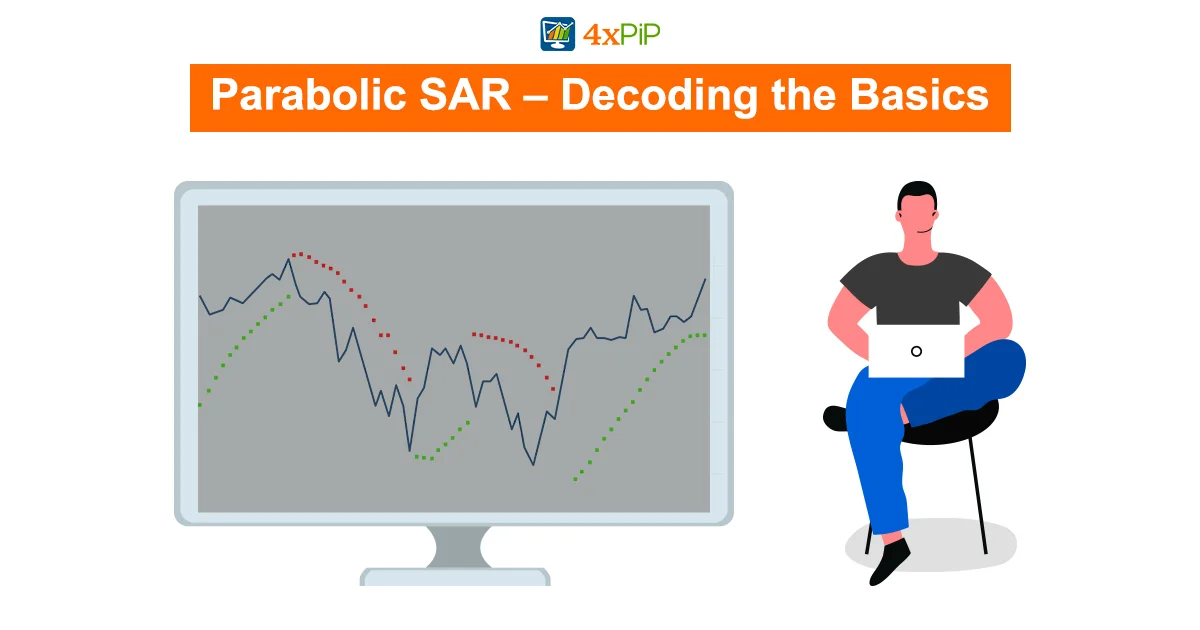
The Parabolic SAR is your compass in the trading world, helping you navigate price changes and predict market trends. Despite its simplicity, choosing the right settings is vital for profitability. With default settings, it lags a bit but catches essential turning points. However, distinguishing between pullbacks and reversals can be tricky. This article delves into whether the ease of Parabolic SAR usage translates to profitability, shedding light on its potential and pitfalls.
Quick Setup Tutorial: Navigating Parabolic SAR:
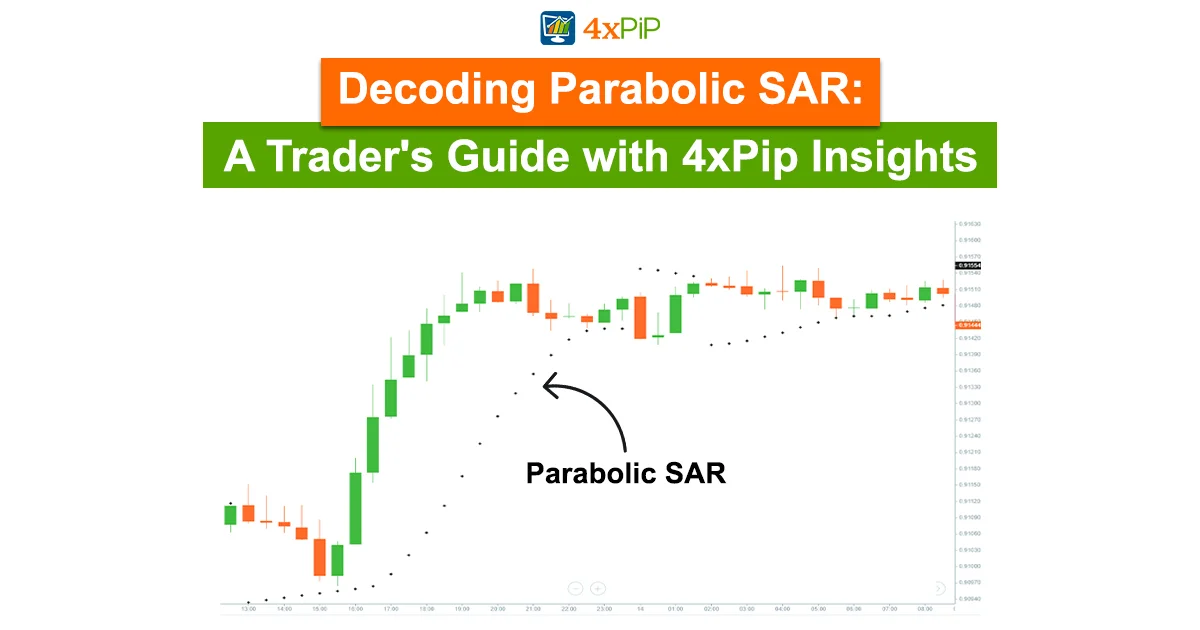
Using the Parabolic SAR involves understanding its signals. For bullish trends, the indicator places a dot at the candle’s bottom; for bearish trends, it’s at the top. The dots’ distance from candles indicates the strength of price momentum. 4xPip suggests viewing these dots as potential stop-loss levels, despite potential size concerns. Understanding the dot-candle distance provides insights into trend momentum, empowering traders to make informed decisions.
Trading Rules for Optimal Results:
To avoid conflicting signals, 4xPip recommends strategic entry points based on consistent Parabolic SAR predictions. The market executes trades when aligned dots appear across three candles, specifically on the 4th candle. To initiate long trades, we set a pending order at the high of the 4th dot, with a stop loss positioned just below. Conversely, short trades involve a pending order at the 4th dot’s low, with a stop loss slightly above. The take profit is strategically set at the first contradicting signal, creating a systematic approach.
Pros and Cons: Navigating Parabolic SAR’s Waters:
The Parabolic SAR, like any tool, has its strengths and weaknesses. It excels in trend identification, strength measurement, and stop-loss indications. However, challenges arise in providing clear entry signals, distinguishing pullbacks from reversals, and handling market consolidations. While it sheds light on momentum, it lacks insights into market volume. 4xPip emphasizes that, despite these drawbacks, Parabolic SAR can be a valuable asset when used in tandem with other indicators.
Uses of Parabolic SAR in Trading Strategies:
Understanding how to harness the power of Parabolic SAR is key. Its primary uses include trend identification, measuring trend strength, and acting as a stop-loss indicator. Additionally, it aids in spotting potential directional changes, such as pullbacks or reversals. While it doesn’t provide a clear entry point, it serves as a reliable support indicator when combined with other tools, enhancing overall trading strategies.
Analysis: Evaluating Profitability Through Backtesting:
Conclusion: The Role of Parabolic SAR in Trading Strategies:
In conclusion, 4xPip emphasizes that while Parabolic SAR offers some wins, relying solely on it is not recommended. the risk-to-reward ratio often falls short due to excessive stop losses. Despite its user-friendly nature, distinguishing pullbacks from reversals requires experience, leading to potential premature exits for beginners. Acknowledging its lagging nature, 4xPip suggests using Parabolic SAR as a support indicator in conjunction with other tools for a more robust trading strategy.
Explore 4xPip’s range of tools, including Expert Advisors and Indicators, to enhance your trading experience. Visit 4xpip for more information or contact customer support at [email protected].


