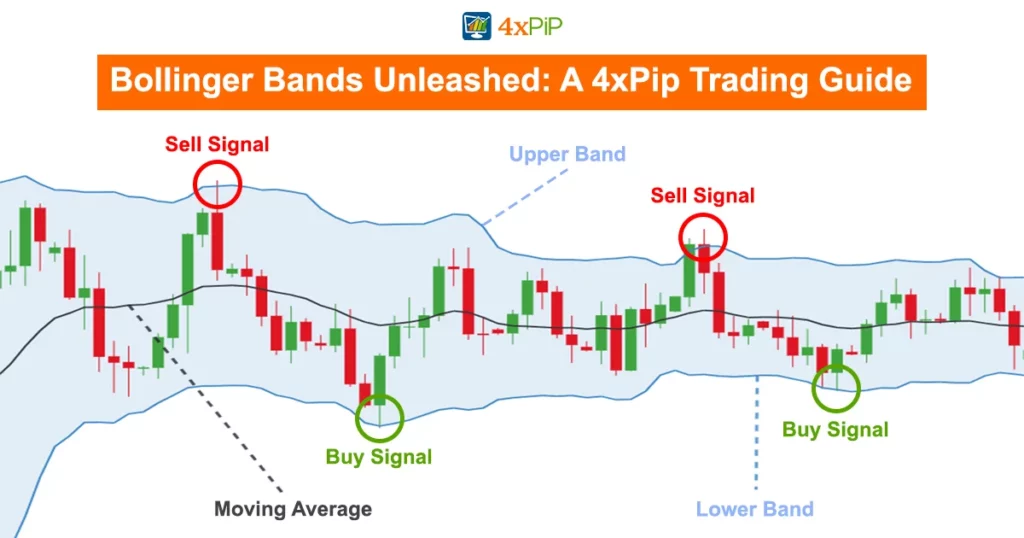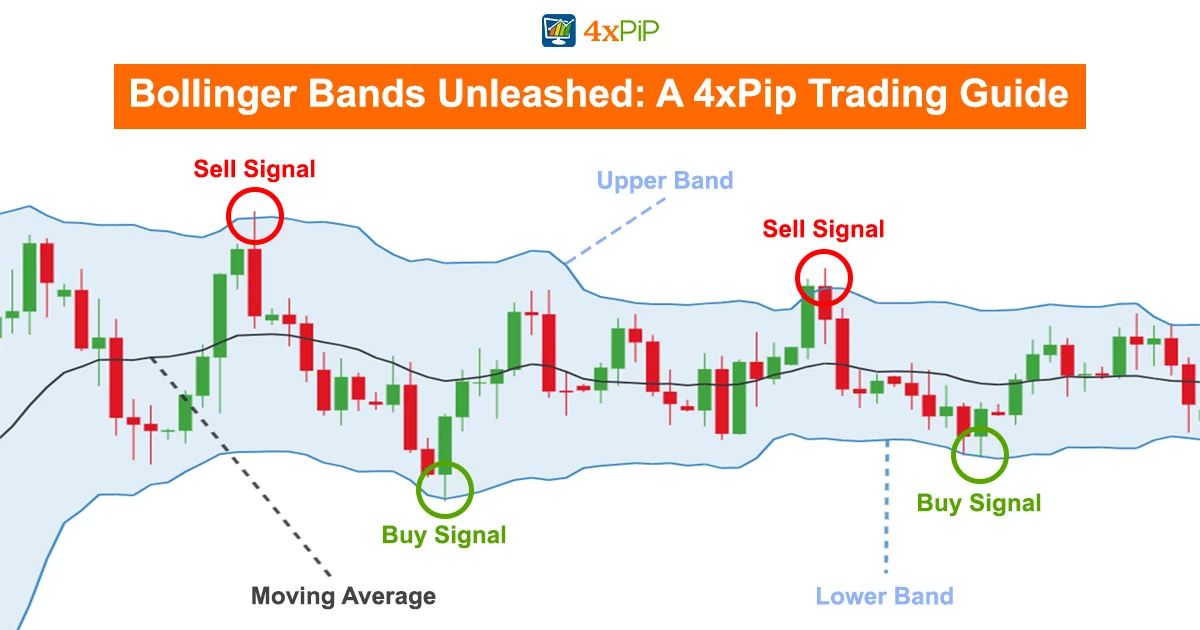
Understanding Bollinger Bands:
Bollinger Bands, a vital tool in technical analysis, created by John Bollinger, offers insights into market conditions. These bands consist of three lines: a simple moving average (SMA), the upper band, and the lower band, deviating by two standard deviations from a 20-day SMA.
Calculating Bollinger Bands:
To calculate, start with the 20-day SMA, considering each day’s closing price. Then, compute the standard deviation of the security price. Multiply the standard deviation by two, adding and subtracting from each point along the SMA to derive the upper and lower bands.
Interpreting Bollinger Bands:
Traders widely believe that as prices approach the upper band, the market is overbought; nearing the lower band suggests oversold conditions. John Bollinger provides 22 rules for effective use. The “squeeze” concept signals low volatility, indicating potential trading opportunities.
Breakouts and Market Dynamics:
Breakouts, occurring outside the bands, signal significant market shifts. However, breakouts alone don’t provide trading signals. Investors often mistake them as buy or sell indicators. Approximately 90% of price action happens between the bands, emphasizing the importance of understanding breakout dynamics.
Example of Bollinger Bands® in Action:
In the provided chart, Bollinger Bands frames the 20-day SMA, adjusting to daily price movements. The bands widen during higher volatility and contract during less volatile periods. This visual representation aids traders in assessing market conditions.
Limitations and Recommendations:
While Bollinger Bands® offers valuable insights, they aren’t standalone systems. John Bollinger recommends using them alongside non-correlated indicators like MACD, on-balance volume, and RSI for comprehensive market signals. Adjusting the 20-day SMA and standard deviation assumptions is crucial, as they may not fit every situation.
Optimizing Bollinger Bands with Indicators:
MT5 Bollinger Bands works best when combined with other indicators like the relative strength indicator (RSI) and BandWidth indicator. The BandWidth measures the width of the bands relative to the middle band, aiding in identifying Bollinger Squeezes.
Accuracy of Bollinger Bands:
Given that MT4 Bollinger Bands are set two standard deviations around an SMA, they encompass about 95% of observed price action. This statistical framework provides traders with a reliable tool for assessing market movements.
Choosing the Right Time Frame:
Bollinger Bands commonly use a 20-day moving average. This timeframe aligns with the statistical assumptions of the bands, providing a balanced view of market dynamics.
Unlock More Trading Potential with 4xPip:
In this article, 4xPip has explored the significance of Bollinger Bands®. For further guidance and automated trading solutions, visit 4xpip.com. Our expert advisors and indicators, such as the Stoploss MT4 EA and Stoploss MT5 EA, can optimize your trading experience. Contact our customer support at [email protected] for additional information and assistance. Don’t miss out on maximizing your trading success with 4xPip!
Conclusion: Empowering Your Trading Strategies:
In conclusion, Bollinger Bands are a versatile tool for traders. By understanding their calculations, interpretations, and limitations, investors can unlock their full potential. Incorporating these bands into a comprehensive trading strategy, alongside other indicators, enhances decision-making and risk management.