Bollinger Bands – a helpful tool used in trading like forex, stocks, and cryptocurrency. Understanding Bollinger Bands can help you make better decisions. Created by John Bollinger, these bands show market volatility and possible trend changes. Simply put, they consist of a moving average with upper and lower bands that adjust based on price changes. 4xPip has resources like MT4 EA Bollinger Band and MT5 EA Bollinger Band for trading. Improve your trading with Bollinger Bands and explore more with 4xPip. Contact us at [email protected] for guidance.
Understanding Bollinger Bands:
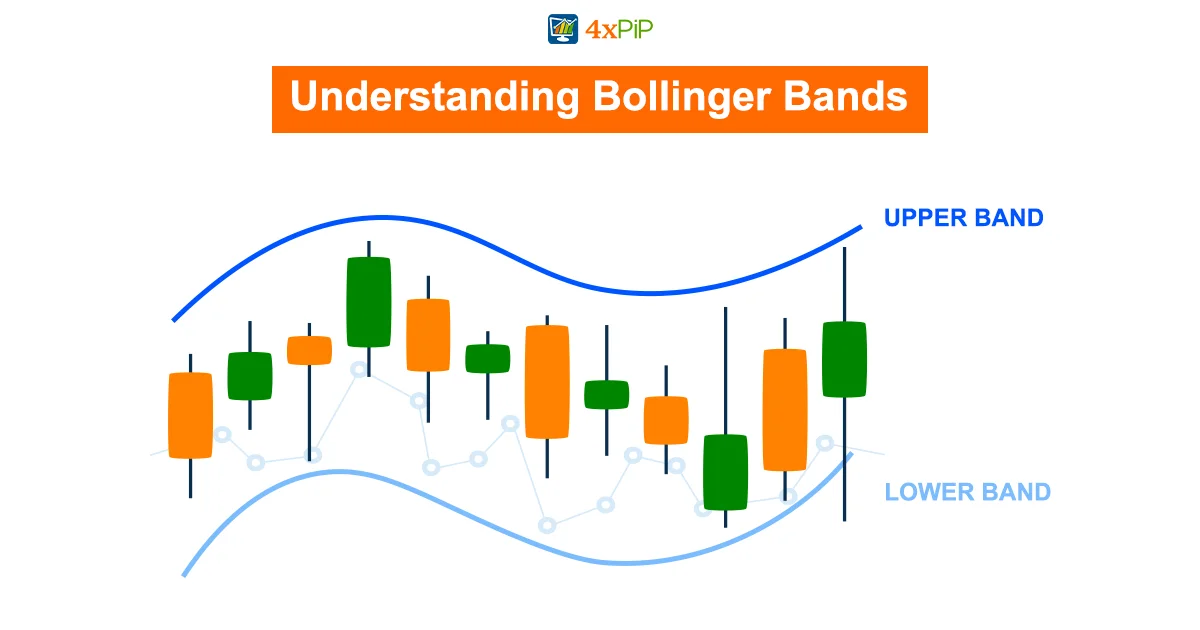
Bollinger Bands are a tool used by traders to spot possible changes in the market. They were made by John Bollinger and include a basic moving average with upper and lower bands to show how much the market is moving. Traders pay attention to prices bouncing inside these bands to make decisions.
When examining market trends, traders look for situations where an asset’s price touches or crosses the upper or lower Bollinger Bands. These points can signal potential reversal points in the market. For example, if the price touches the upper band, it might indicate an overbought condition, suggesting a possible reversal to the downside. On the other hand, a touch or crossing of the lower band could suggest an oversold condition, signaling a potential upward reversal.
Traders often place buy trades when an asset’s price touches the lower Bollinger Band, anticipating a potential upward reversal. On the flip side, sell trades may be considered when the price touches the upper band, expecting a potential downward reversal. Traders need to complement Bollinger Bands analysis with other indicators and market conditions to make well-informed decisions.
Understanding when to place stop-loss, and take-profit, and determining lot size are critical aspects of risk management. A trader may set a stop-loss just beyond the Bollinger Bands to mitigate losses in case the market does not behave as anticipated. Take-profit levels can be strategically placed at the opposite Bollinger Band, ensuring that profits are secured during potential reversals. Additionally, lot size should align with the trader’s risk tolerance and overall portfolio strategy.
Bollinger Bands Strategies for Successful Trading:
Bollinger Bands consist of a middle band (usually a 20-period simple moving average) and two outer bands showing price deviations. Understanding how to use Bollinger Bands beyond the basics can improve your trading success.
For buying, consider making a move when the price touches or goes below the lower band, indicating potential undervaluation. It’s essential to check other indicators and market conditions for confirmation. Remember, Bollinger Bands alone are not foolproof.
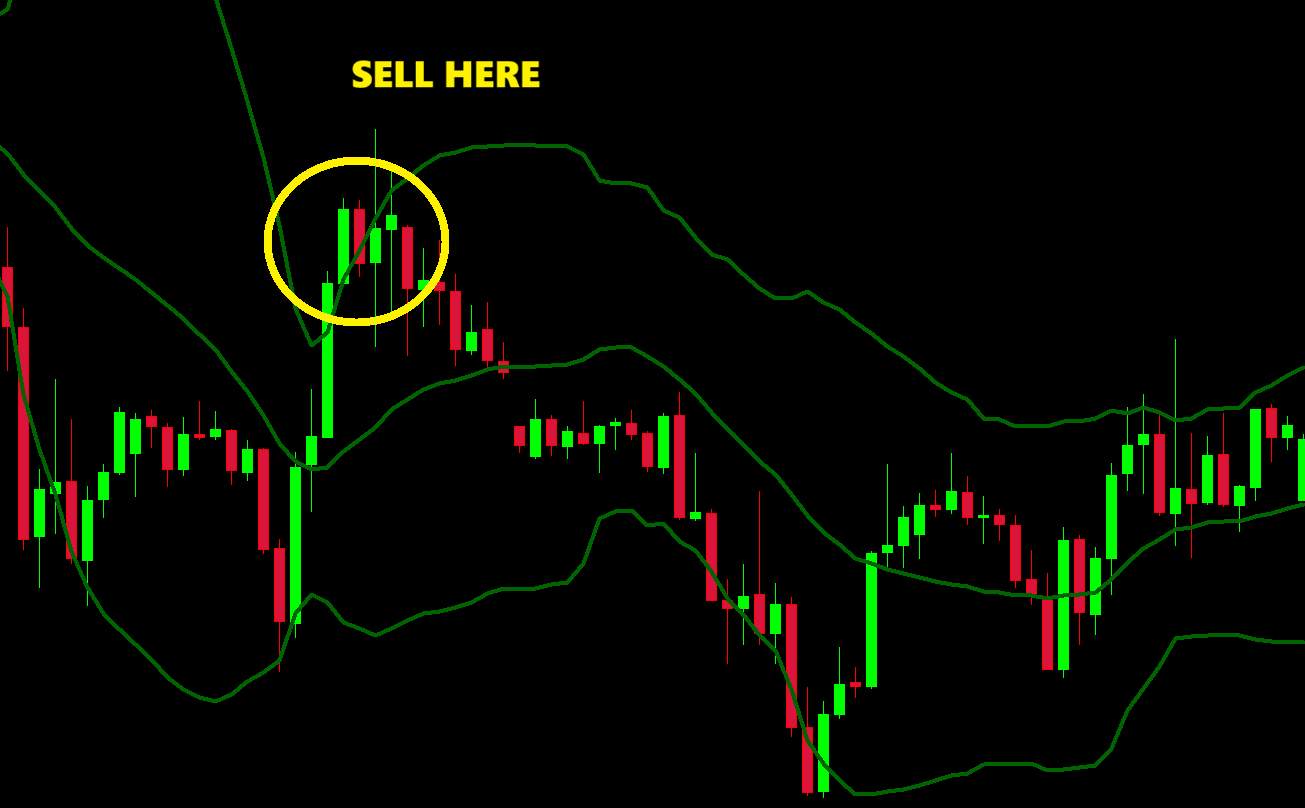
On the flip side, selling may be an option when the price touches or exceeds the upper band, signaling potential overvaluation. Verify this signal with other indicators to avoid false alarms. Combining Bollinger Bands with other tools boosts decision-making accuracy.
Managing risks is crucial. Bollinger Bands helps determine suitable levels for stop-loss and take-profit orders. Place a stop-loss just below the lower band for a long position and just above the upper band for a short position. Set take-profit levels based on historical price movements or key support and resistance levels. Calculate lot size considering your risk tolerance, stop-loss distance, and overall account size.
Bollinger Bands in Technical Analysis:
One way to use Bollinger Bands is to find good times to buy. If prices touch or go below the lower band, it might mean the asset is undervalued, making it a good time to consider a buy trade. However, it’s important to be cautious and double-check signals using other indicators and factors like market trends.

On the flip side, selling opportunities may arise when prices touch or go beyond the upper band. This could mean the asset is overvalued, suggesting it’s a good time to think about selling. To make well-informed decisions, it’s crucial to combine Bollinger Bands with other tools and not rely solely on one indicator.
Risk management is a big deal in trading, and Bollinger Bands can help with that too. Setting stop-loss and take-profit levels is important for protecting your money and maximizing profits. Traders can use the upper and lower bands to determine these levels. Figuring out the lot size is also key to managing risk effectively. By aligning these factors with insights from Bollinger Bands, traders can create a solid strategy for success in trading.
Analyzing Forex with Bollinger Bands:
Bollinger bands, consisting of a middle line and two standard deviation lines, help investors gauge market volatility and potential price movements. When delving into the realm of trading, understanding the optimal moments to initiate buy or sell trades is crucial for success.
When you see the price touching the bottom line of the Bollinger Bands, it’s a good time to think about buying. This means the currency might be undervalued, and there’s a chance the market will turn around. It’s like a signal for traders to grab a good deal before prices go up.
Inversely, if the price hits the top line, it’s a hint that the currency might be overpriced. This is a cue for traders to sell at the highest point before the market corrects itself. Keeping an eye on these levels helps traders make better choices and improve their trading game.
Managing risk is really important in forex trading, and Bollinger Bands can help with that. Traders can use stop-loss and take-profit orders by lining them up with the Bollinger Bands. Placing a stop-loss just outside the bands can protect against losses if the market goes against the initial prediction. For taking profits, setting orders near the opposite band secures gains when the market is favorable. Choosing the right lot size is also important, considering your risk tolerance and account size.
Bollinger Bands and Expert Advisors:
Bollinger Bands, created by John Bollinger, show how prices in a market move. They use a simple average and two lines to help traders find good times to enter or exit trades. When the price hits the top line, it might mean it’s too high, suggesting a sale. If it touches the bottom line, it might be too low, hinting at a buy.
Expert Advisors (EAs) are computer programs that make trading easier. They act like robots, following specific rules to make trades for traders. Combining Bollinger Bands with EAs makes trading better. For example, traders can set up EAs to buy when prices touch the bottom Bollinger Band and sell when prices get close to the top band. This automation helps with quick trades, removes emotions, and makes trading more disciplined. Adding MT4 EA Bollinger Band and MT5 EA Bollinger Band to your toolkit gives you a flexible way to navigate changing markets.
MT4 EA Bollinger Band:
DOWNLOAD NOWMT5 EA Bollinger Band:
DOWNLOAD NOWAdvanced Strategies with Bollinger Bands:
One strategy is to look for times when the bands squeeze close together, indicating low volatility. This suggests a possible big price move soon. Traders can take advantage of this by entering a trade, and expecting a breakout. For example, in forex, a trader might buy if the price goes above the upper band (indicating an uptrend) or sell if it goes below the lower band (suggesting a potential downtrend).
To manage risks, it’s important to use tools like stop-loss orders, take-profit levels, and control the size of the trade. Placing a stop-loss just beyond the outer bands helps protect against sudden market changes. You can set take-profit levels based on past price movements or support/resistance levels. Calculating the trade size is crucial, considering the trader’s risk tolerance and the distance to the stop-loss.
Summary:
Enhance your trading prowess with Bollinger Bands and expert tools like MT4 EA Bollinger Band and MT5 EA Bollinger Band from 4xPip. Discover insights into market volatility and trend changes, empowering informed decision-making. Contact [email protected] for expert guidance.
FAQ’s
What are Bollinger Bands?
Bollinger Bands, a technical analysis tool, depict market volatility and potential trend reversals. They consist of a moving average with upper and lower bands that adjust based on price movements.
How do traders use Bollinger Bands?
Traders utilize Bollinger Bands to identify potential buy and sell signals based on the price touching or crossing the bands. For instance, a touch of the lower band may signal a buying opportunity, while a touch of the upper band may indicate a selling opportunity.
Who created Bollinger Bands?
John Bollinger, a renowned technical analyst, created Bollinger Bands as a tool to aid traders in analyzing market volatility and trend changes.
What is the significance of the middle band in Bollinger Bands?
The middle band, typically a 20-period simple moving average, serves as the baseline for the bands and helps traders gauge the overall trend direction.
How do Bollinger Bands assist in risk management?
Bollinger Bands aid in risk management by providing reference points for setting stop-loss and take-profit levels. Traders often place stop-loss orders just beyond the bands to mitigate potential losses.
Can Bollinger Bands be used alone for trading decisions?
While Bollinger Bands provide valuable insights into market volatility, it’s advisable to complement their analysis with other indicators and market conditions for well-informed trading decisions.
What role do Expert Advisors (EAs) play in Bollinger Bands trading?
Expert Advisors can automate trading based on Bollinger Bands signals, executing trades according to predefined rules without emotional bias, thereby enhancing trading discipline.
How can traders identify potential breakout opportunities using Bollinger Bands?
Traders can look for periods of low volatility indicated by the bands squeezing close together, which may precede significant price movements. Breakout trades are initiated when prices breach the bands.
What factors should be considered when determining lot size in Bollinger Bands trading?
To ensure effective risk management, traders should calculate lot size based on their risk tolerance, stop-loss distance, and overall account size.
How can traders ensure the accuracy of Bollinger Bands signals?
To validate Bollinger Bands signals, traders should corroborate them with other technical indicators and fundamental analysis, ensuring a comprehensive assessment of market conditions before executing trades.


