Bollinger Bands, a creation of John Bollinger in the 1980s, is an adaptable technical analysis tool applicable to various financial instruments such as indices, currencies, and stocks. As indicators of overbought or oversold conditions and a measure of volatility, Bollinger Bands play a crucial role in market analysis.
What are Bollinger Bands?
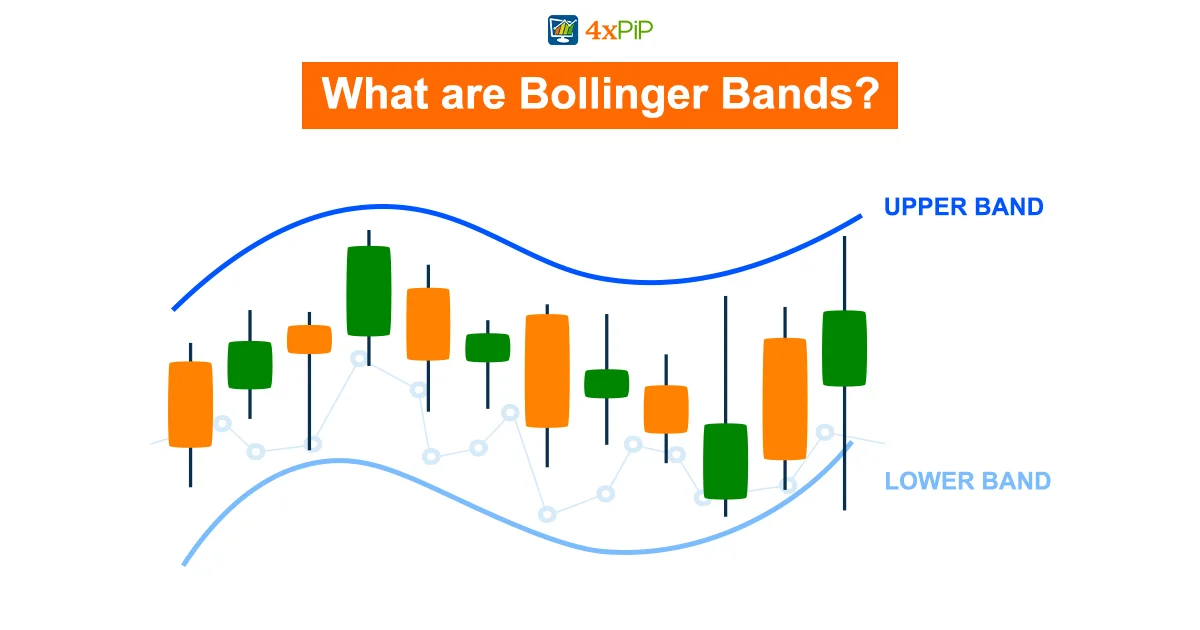
Bollinger Bands consist of three lines on a trading chart. The middle line is the 20-day Simple Moving Average (SMA), surrounded by an upper band (SMA + 2 standard deviations) and a lower band (SMA – 2 standard deviations). These bands act as an envelope around the instrument’s price, with widths determined by the standard deviation, representing price volatility.
Bollinger Band Calculation Formula:
The calculation involves a 20-day SMA and 2 standard deviations. The upper band is calculated as (20-day SMA + 2 * 20-day standard deviation), and the lower band as (20-day SMA – 2 * 20-day standard deviation).
How to Use Bollinger Bands:
Traders use Bollinger Bands on different timeframes to spot overbought or oversold conditions. When the price gets close to the upper band, it indicates overbought, suggesting a chance to sell. On the flip side, if it heads to the lower band, it hints at oversold conditions, suggesting a potential buying opportunity.
Complementary Tools: Moving Averages, Stochastic Indicator, ATR, and Keltner Channels:
While Bollinger Bands are powerful, combining them with other indicators enhances precision. Moving averages, Stochastic indicators, Average True Range (ATR), and Keltner Channels are valuable additions. Our new platform easily combines tools, helping traders make smart decisions.
Bollinger Bands Strategy:
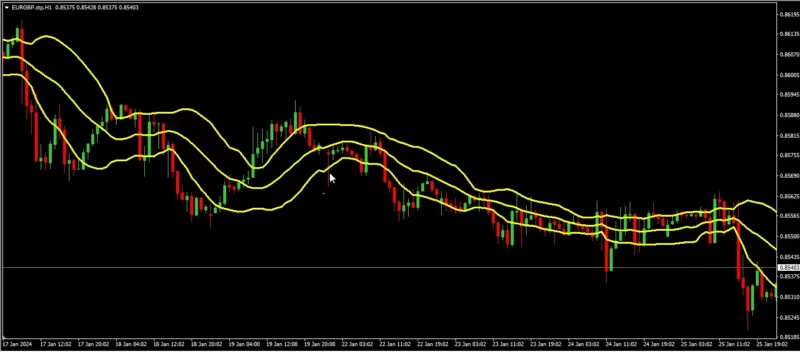
Traders use Bollinger Bands in different ways. One strategy is “riding the bands,” but be cautious and don’t mistake band penetrations for signals. Another strategy, the “Bollinger Band squeeze,” predicts higher volatility when the bandwidth hits a six-month low. When using these strategies, it’s important to know when to buy and sell. Consider buying when prices touch the lower band, indicating a potential buying opportunity. On the other hand, think about selling when prices touch the upper band, suggesting a possible reversal. Understanding these strategies and their signals helps traders navigate the markets more accurately.
Best Bollinger Bands Settings:
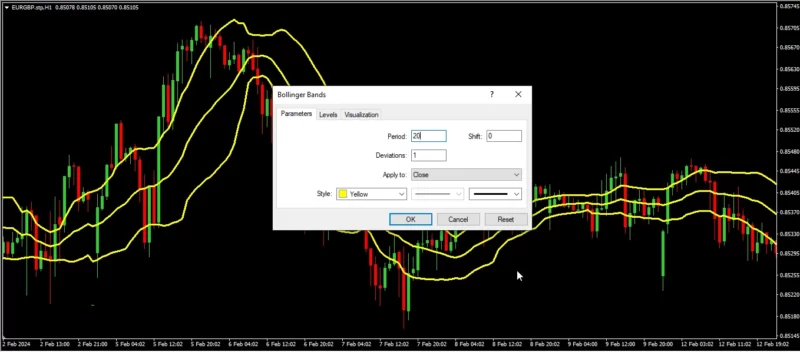
Tailoring Bollinger Bands to different timeframes and trading strategies is essential. Long-term traders may prefer monthly charts, while day traders opt for shorter timeframes. There’s no universal timeframe; it depends on the trader’s strategy.
Bollinger Band Patterns:
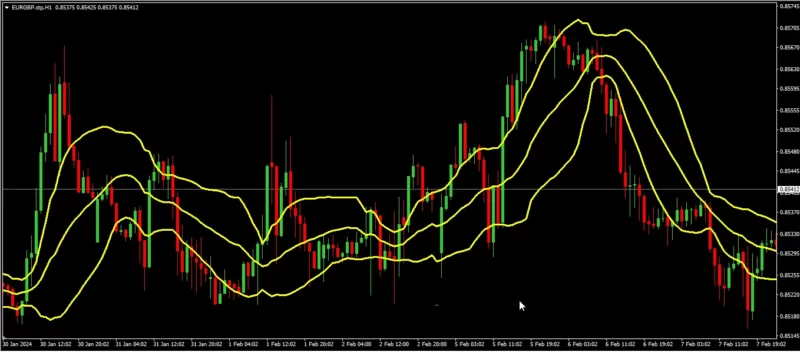
Traders gain insights by spotting patterns like double bottoms and reversals. Double bottoms show a switch from sellers to buyers, often leading to upward movements. Reversal patterns, breaking upper or lower bands, may indicate trend changes.
Bollinger Band Trading System:
Our user-friendly online trading indicator site has various analysis indicators, like Bollinger Bands. Traders easily use indicators, draw trendlines, and find buy/sell points. 4xPip tutorials help users maximize their experience.
How to Interpret Bollinger Bands:
Bollinger Bands work but have limits. They react to prices, not predict them, leading to possible false signals. To overcome this, traders adjust settings based on their strategies. Many combine Bollinger Bands with other indicators for a comprehensive approach.
Conclusion:
To master Bollinger Bands, understand how they work, use them with other tools, and customize them for your strategy. Discover their power on our Next Generation indicators for a better trading experience with 4xPip. Explore the site’s EAs, including Bollinger Bands, and begin your trading journey now. For help, contact 4xPip’s expert support at [email protected].
FAQ’s
What are Bollinger Bands and how do they work in market analysis?
Bollinger Bands indicate overbought or oversold conditions and measure volatility in financial instruments.
How do Bollinger Bands help traders identify overbought or oversold conditions?
When prices approach the upper band, it signals overbought, prompting potential selling opportunities.
Can Bollinger Bands be used on different timeframes, and how are they adjusted?
Yes, Bollinger Bands are versatile, adaptable to various timeframes, and can be adjusted for different trading styles.
What is the significance of combining Bollinger Bands with other technical indicators?
Combining with tools like moving averages and stochastic indicators enhances precision in market analysis.
What strategies do traders use with Bollinger Bands for bear or bull markets?
Popular strategies include “riding the bands” and the “Bollinger Band squeeze” for identifying potential market movements.
How do traders set the best Bollinger Bands settings for their trading strategies?
Setting Bollinger Bands depends on the trader’s strategy, with no universal timeframe suitable for all.
What Bollinger Band patterns should traders recognize for actionable insights?
Identifying patterns like double bottoms and reversals provides traders with valuable and actionable insights.
What role does the Bollinger Band trading system play on the Next Generation platform?
The Next Generation platform integrates Bollinger Bands seamlessly, allowing traders to make informed decisions with technical analysis.
What are the limitations of Bollinger Bands, and how can traders mitigate risks?
Bollinger Bands are reactive but prone to false signals. Traders often use them in conjunction with other indicators for a holistic approach.

