Bollinger Bands are a useful tool for understanding financial markets. They show price and volatility using a chart. Picture a band around an average price, with an upper and lower part. These bands change based on market activity, helping investors spot situations where prices may be too high or too low. Bollinger Bands work by using two lines above and below an average price, adjusting to market ups and downs. Wider bands mean more market ups and downs, while narrower bands mean things are calmer. This helps traders see potential changes in the market, like pullbacks or trend reversals. Now, imagine boosting their effectiveness by using Expert Advisors made for MetaTrader 4 and MetaTrader 5.
The Bollinger Band EA of MT4 and Bollinger Band EA of MT5 by 4xpip combines traditional analysis with advanced automation. They are reliable Expert Advisors that work with Bollinger Bands, adapting to market changes. The EAs follow a simple strategy: they buy when the price is low and sell when it’s high, using the Bollinger Bands as a guide. This makes trading smoother and more automated. Email us at [email protected] to get help with Bollinger Bands from our experts.
What are Bollinger Bands?
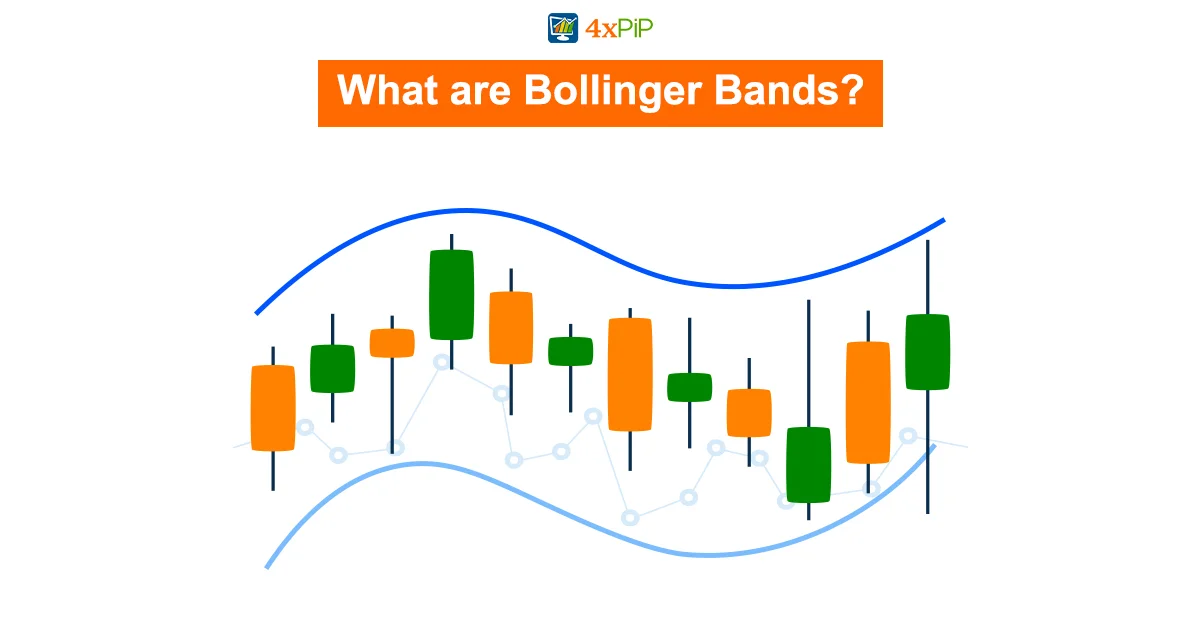
Bollinger Bands are a dynamic tool that adjusts to different market conditions, unlike static models. They consist of three lines – an upper band, a lower band, and a middle band (a 20-day simple moving average). The bands widen when the market is more volatile and narrow during calmer times. Traders find them useful because they can show support and resistance levels in various securities.
The Origin of Bollinger Bands:
In the mid-80s, John Bollinger, a financial expert, came up with Bollinger Bands, a useful tool for understanding market movements. He got the idea from J. Welles Wilder Jr.’s use of standard deviation to measure volatility. Bollinger Bands are like a flexible border around price bars, showing how the market is moving.
Before Bollinger Bands, others like Wilfrid Ledoux tried to measure market volatility, but Bollinger improved the concept. The modern Bollinger Bands came from Donchian Bands, but Bollinger added standard deviation, giving them a big advantage. Using standard deviation, which shows how much prices vary, makes Bollinger Bands flexible and quick to react to market changes. That’s why many traders use them.
John Bollinger didn’t just create Bollinger Bands; he also started Bollinger Capital Management, a company focused on analyzing markets and giving investment advice. His book, “Bollinger on Bollinger Bands,” explains how to use Bollinger Bands in different market situations, making him a respected figure in financial analysis.
Key Components and Calculation:
Bollinger Bands rely on three main parts: upper band, lower band, and middle band (a 20-day average). The upper and lower bands use standard deviation, showing how much prices vary. This creates a range around the average, showing how the security’s price moves.
To calculate Bollinger Bands, you need to know standard deviation. It measures how much numbers differ from the average. Multiply the standard deviation by two and adjust it with the average to get the upper and lower bands. This helps traders by giving precise bands that react to market changes.
Here’s how it works: Start with a 20-day average. Then, use standard deviation to see how much prices differ from this average. Multiply the standard deviation by two to create a range that covers potential price changes.
In simple terms, standard deviation is crucial. It shows how much values differ from the average, giving a measure of how uncertain the market is. If standard deviation is high, the bands are wide, showing more uncertainty. If it’s low, the bands are narrow, indicating a steadier market. This calculation is the core of Bollinger Bands, making them a useful tool for traders in the financial markets.
At the same time, the Bollinger Band EA of MT4 and Bollinger Band EA of MT5 improves how we calculate things. Traders can test and improve the Expert Advisors to match their preferred trading strategies. The combination of Bollinger Bands’ past success and the EA’s modern efficiency makes them a strong tool for traders.
Application in Technical Analysis:
Bollinger Bands are important tools in stock analysis. They help traders make decisions by showing how prices move. The bands represent volatility and can tell if a stock is overbought or oversold. By looking at where a stock is compared to these bands, traders can predict if the price will go up or down.
One key use of Bollinger Band is to confirm if a trend is starting or ending. If the price goes above the upper band, it’s a bullish sign, suggesting the price may go up. If it goes below the lower band, it’s bearish, indicating the price may drop. Traders use these signals to know when to buy or sell, making it easier to follow market trends.
Bollinger Bands are useful because they adjust to how the market is behaving. They become wider when the market is volatile and narrower when it’s calmer. This visual cue helps traders understand the current market conditions. The dynamic nature of Bollinger Bands makes them useful for different types of stocks and market situations.
Upper Bollinger Bands in Technical Analysis:
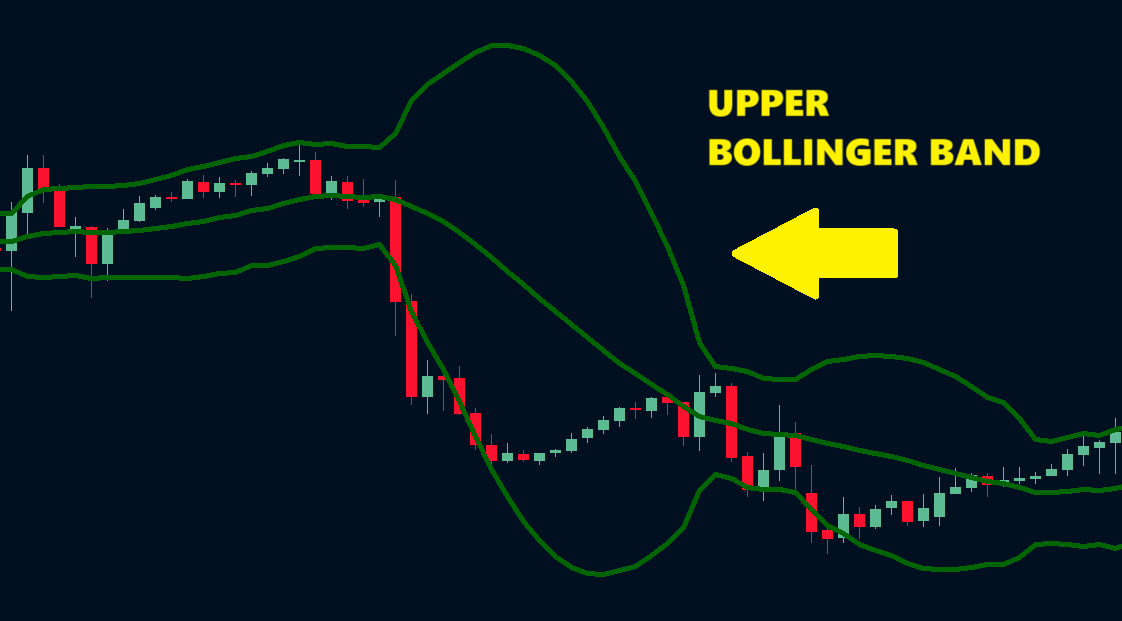
The upper Bollinger Band is like a top point on a price chart, giving traders useful information. Additionally, it helps them make decisions by showing if prices are too high; moreover, it indicates if there might be a breakout or if there’s resistance. This is important for traders dealing with the ups and downs of financial markets.
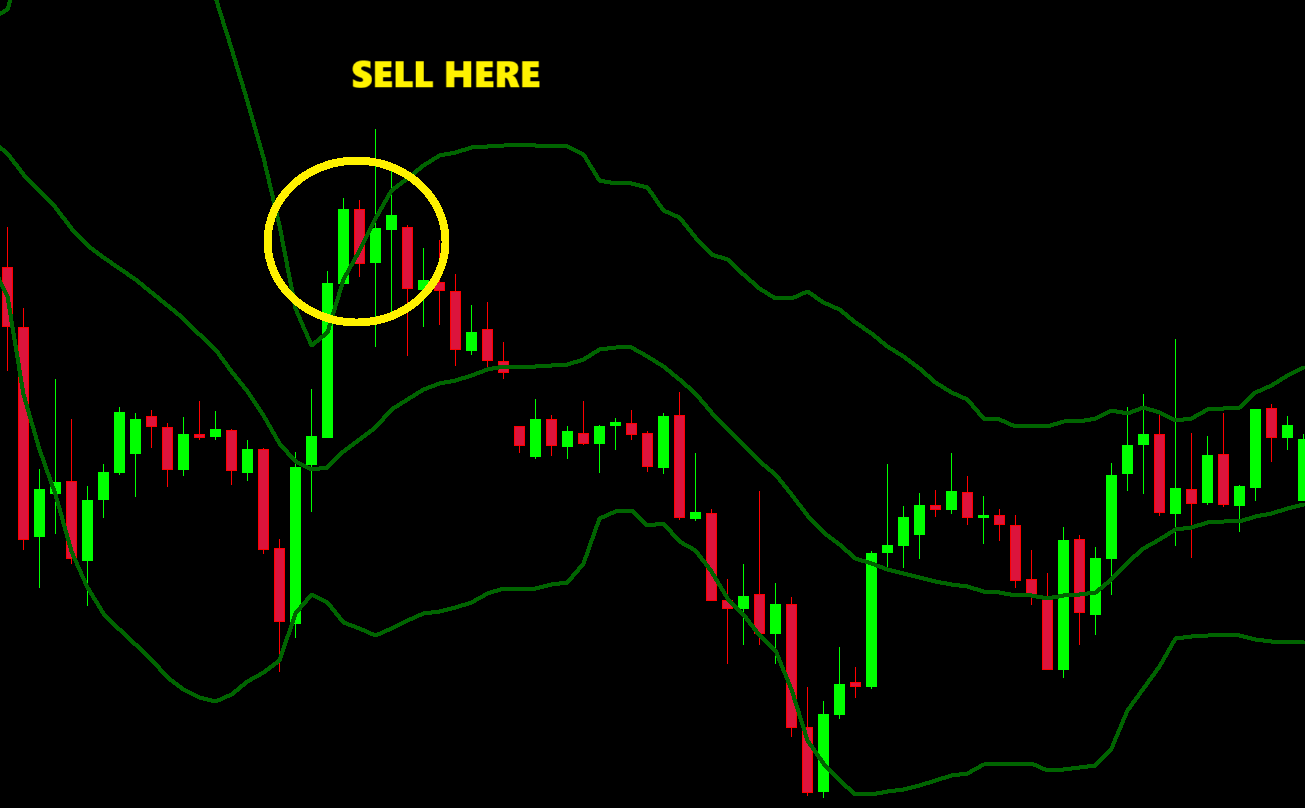
Traders who want to make more money when prices are rising keep a close eye on the upper Bollinger Band. If the price gets close to or goes beyond this point, it might mean prices are too high. This could mean the investment is overvalued, and there might be a drop or a change in direction. Traders use this information along with other indicators to make smart choices.
The Bollinger Band EA of MT4 and Bollinger Band EA of MT5 help turn insights into practical strategies. For buying trades, it sets a take-profit point at the upper band, which historically is an important level. This helps traders make the most of potential profits by following the upward trend shown by the upper Bollinger Band.
Lower Bollinger Bands in Technical Analysis:
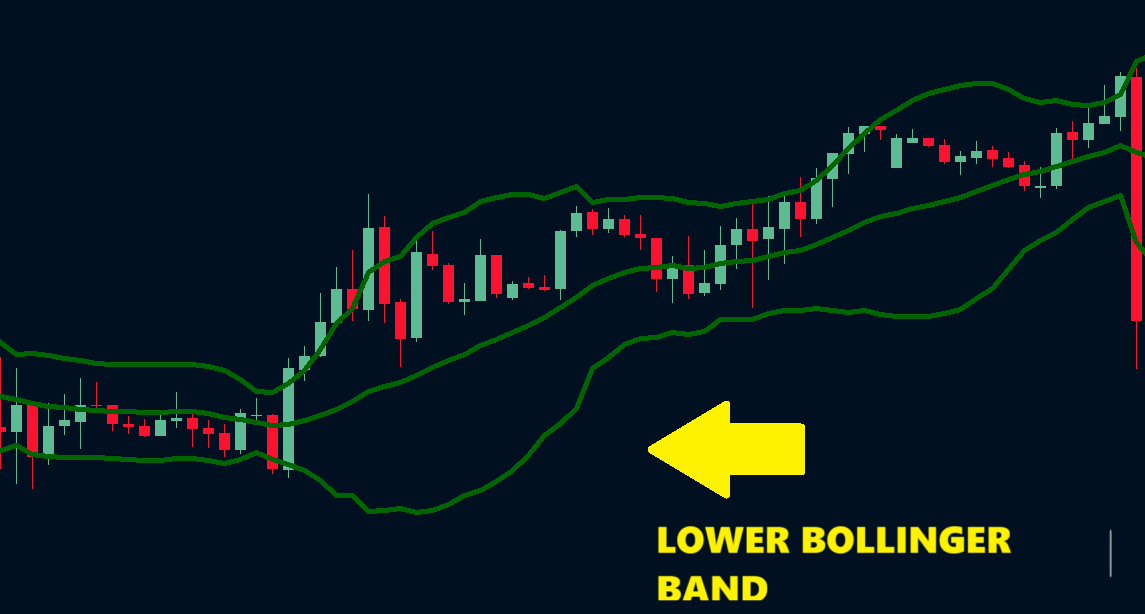
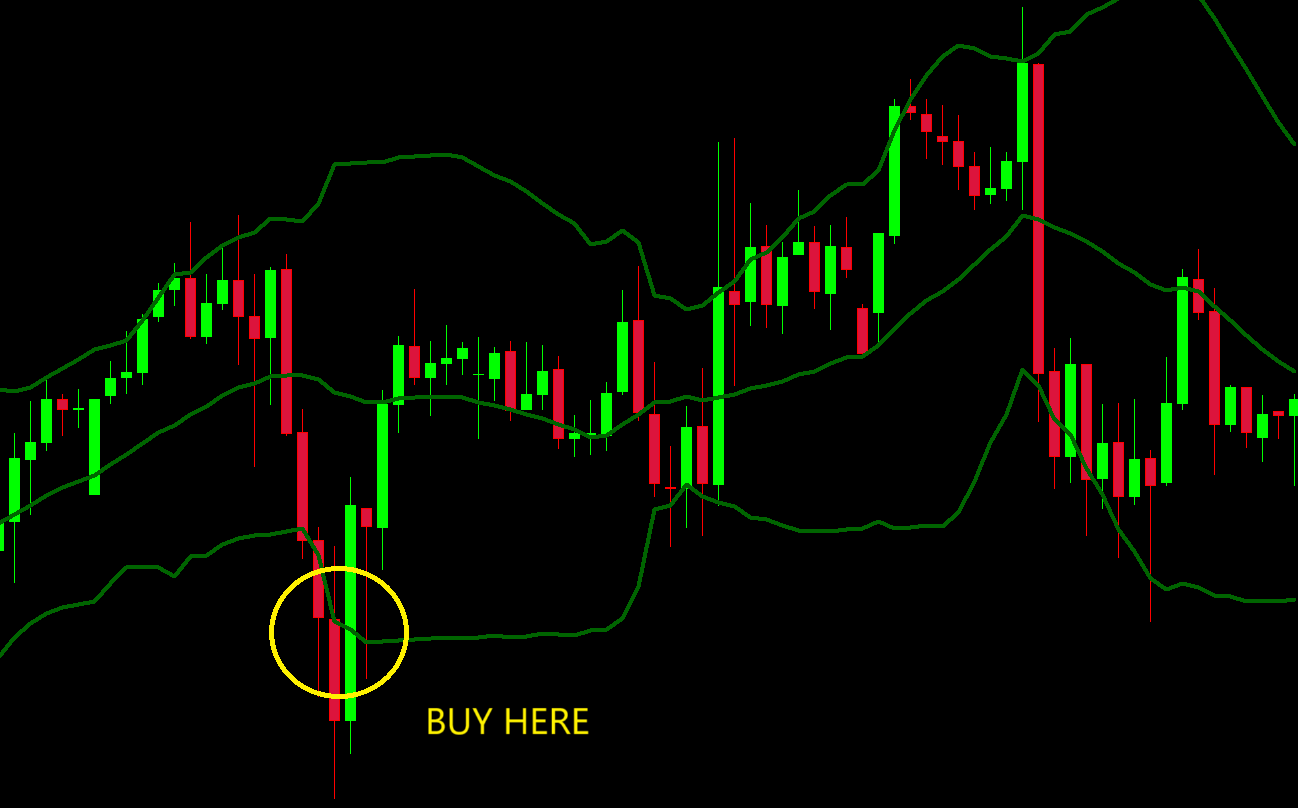
The lower Bollinger Band helps us spot when a stock might be undervalued or oversold, signaling a chance for a comeback. If the price gets close to or drops below this lower band, it could mean a good opportunity to buy. Traders use this information to predict changes in market mood and position themselves wisely.
Additionally, the lower Bollinger Band is handy for finding support levels. When the price hits or goes below the lower band and then bounces back up, it indicates a potential support area. Traders use this data to weigh risks and rewards, placing stop-loss orders below the lower band to manage possible losses.
The partial trade closing of the Bollinger Band EA of MT4 and Bollinger Band EA of MT5 helps traders. It closes half of the trade when it reaches the middle Bollinger Band. This secures half of the profit and matches the lower band, which could act as support.
Bollinger Band EA of MT4:
DOWNLOAD NOWBollinger Band EA of MT5:
DOWNLOAD NOWBuy and Sell Signals Using Bollinger Bands:
Bollinger Band Squeeze: When volatility decreases, the bands narrow, indicating a potential price breakout. Traders may consider buying when the price breaks above the upper band or selling when it breaks below the lower band.
Overbought and Oversold Conditions: When prices touch or exceed the upper band, the asset is considered overbought. Conversely, when prices touch or fall below the lower band, the asset is considered oversold. Traders may see these conditions as opportunities to sell or buy, respectively.
Middle Band Cross: A crossover of the price over the middle band may signal a potential uptrend, while a crossover below the middle band may indicate a potential downtrend.
Earning More Profit Using Bollinger Bands:
Trend Confirmation: Confirming a trend using Bollinger Bands can be crucial. If the price is consistently riding the upper band during an uptrend or the lower band during a downtrend, it suggests a strong trend.
Volatility Breakouts: Trading breakouts from the bands during periods of high volatility can lead to profitable opportunities. Traders may enter positions when the price breaks above the upper band or below the lower band.
Combining with Other Indicators: Integrating Bollinger Bands with other indicators, such as the Relative Strength Index (RSI) or Moving Average Convergence Divergence (MACD), can provide more comprehensive signals.
Setting Stop Loss, Take Profit, and Lot Size:
Stop Loss: Traders often set a stop loss slightly beyond the outer bands to allow for market noise. The level should be determined based on individual risk tolerance, market conditions, and the asset’s volatility.
Take Profit: Take profit levels can be set at a predefined target, such as a significant support/resistance level or a fixed percentage gain. The risk-reward ratio, calculated based on Bollinger Bands and market conditions, should guide this decision.
Lot Size: Lot size is determined by the trader’s risk management strategy. It should be adjusted to ensure that the potential loss, if the stop loss is hit, aligns with the trader’s overall risk tolerance and account size.
Summary:
Bollinger Bands consist of upper, lower, and middle bands that change with market ups and downs. Created by John Bollinger, they use standard deviation to show how prices vary around a 20-day average. This helps traders spot trends, figure out if prices are too high or low, and find breakout chances. You can use Bollinger Bands with the Bollinger Band EA of MT4 and Bollinger Band EA of MT5 from 4xpip. These EAs mix traditional analysis with smart automation, adjusting to market shifts. They’re reliable Expert Advisors for traders. The 4xpip Bollinger Band EAs follow a simple strategy: buy low and sell high, making trading more efficient and automated. If you need help or want more info, email [email protected].
FAQ’s
What are Bollinger Bands?
Bollinger Bands are dynamic indicators comprising upper, lower, and middle bands that adjust to market conditions, indicating volatility and potential overbought or oversold levels. Additionally, they provide valuable insights into price trends.
How did Bollinger Bands originate?
John Bollinger introduced Bollinger Bands in the mid-80s, drawing inspiration from J. Welles Wilder Jr.’s volatility measurement using standard deviation. Additionally, Bollinger’s innovation improved upon previous attempts to gauge market volatility.
What role does standard deviation play in Bollinger Bands?
Standard deviation is crucial in calculating Bollinger Bands, helping measure the uncertainty in the market. Higher standard deviation results in wider bands, reflecting increased uncertainty, while lower deviation leads to narrower bands, indicating a steadier market.
How does the Bollinger Band EA of MT4 and Bollinger Band EA of MT5 enhance trading strategies?
The Expert Advisors from 4xpip automate Bollinger Bands-based trading strategies, buying low and selling high. Traders can customize and optimize the EAs to align with their preferred trading strategies.
What is the significance of the upper Bollinger Band in technical analysis?
The upper Bollinger Band serves as a reference point to identify overvaluation; additionally, it helps spot potential breakouts or resistance levels.
How does the lower Bollinger Band assist traders?
The lower Bollinger Band helps spot undervalued or oversold stocks, signaling potential buying opportunities. Traders also use it to identify support levels, managing risks with stop-loss orders.
What are common buy and sell signals using Bollinger Bands?
Bollinger Band Squeeze indicates potential breakouts, overbought conditions occur when prices touch the upper band, oversold conditions when touching the lower band, and crossovers with the middle band signal potential trend changes.
How can Bollinger Bands confirm trends?
Consistent riding of the price along the upper or lower band during an uptrend or downtrend, respectively, confirms a strong trend.
What is the significance of volatility breakouts with Bollinger Bands?
Trading breakouts during high volatility periods by entering positions above the upper band or below the lower band can lead to profitable opportunities.
How should traders set stop loss, take profit, and lot size using Bollinger Bands?
Stop loss is often set slightly beyond the outer bands; additionally, take profit at predefined targets or percentage gains. Moreover, lot size should align with the trader’s risk management strategy and account size, considering market conditions and volatility.