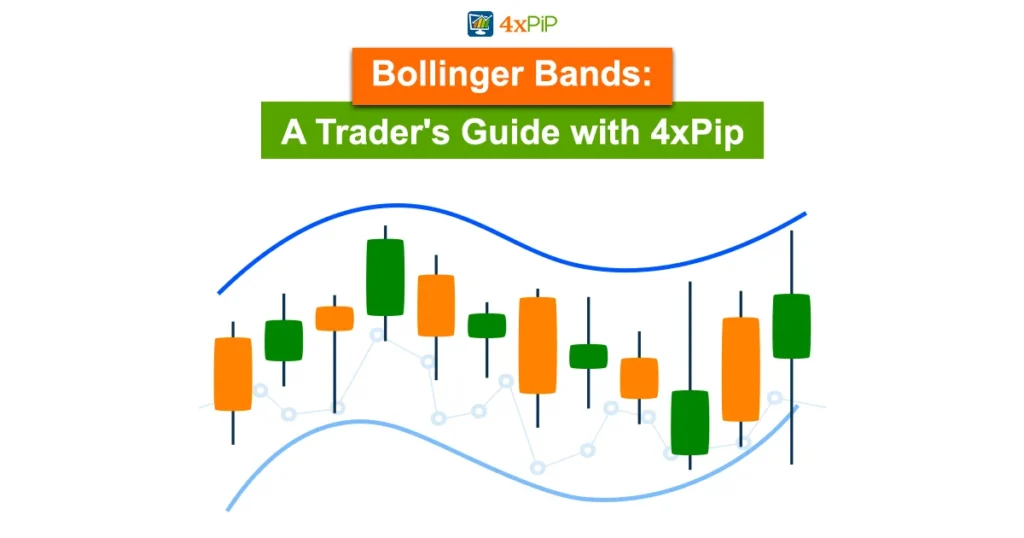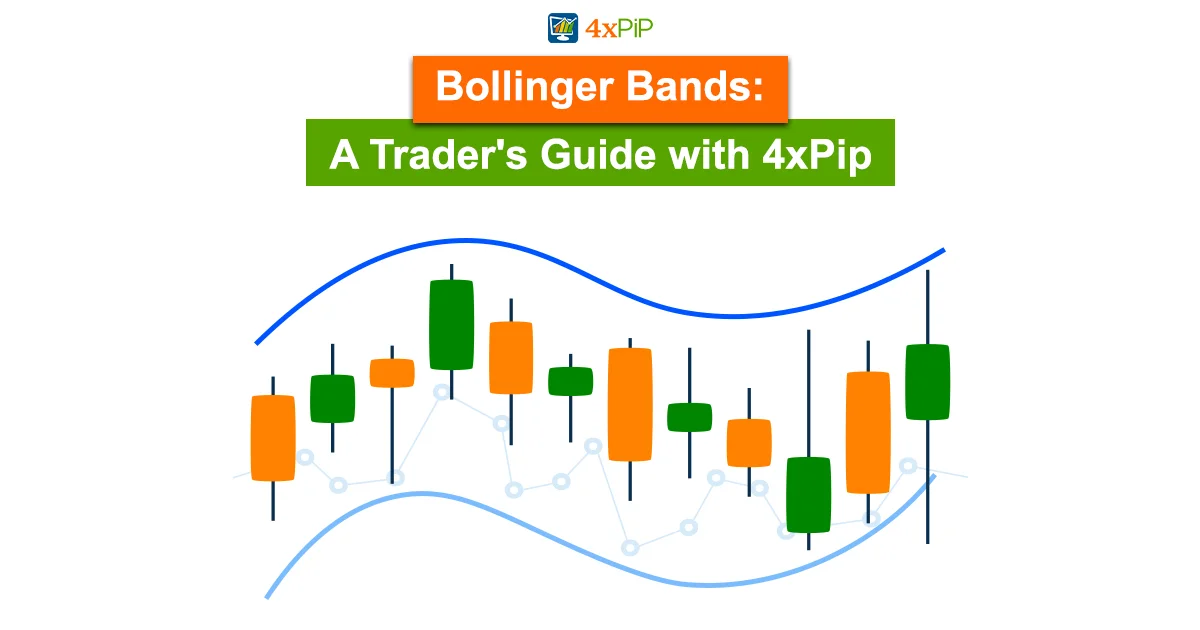
In the fast-paced world of trading, mastering technical indicators is key. Bollinger Band, a trader’s ally, is obvious for revealing market trends, support, and resistance. This detailed guide, presented by 4xPip, unveils the intricacies of Bollinger Bands and how they can revolutionize your trading strategy.
Introduction to Bollinger Bands and 4xPip’s Trading Platform:
Bollinger Band, a popular technical indicator, consists of upper and lower bands around a Simple Moving Average (SMA). At 4xPip, our online trading platform offers interactive charts, simplifying technical analysis for traders exploring stocks, cryptocurrency, and forex.
Understanding Bollinger Band is crucial, as they showcase areas of support and resistance, aiding in strategic decision-making for traders. Now, let’s dive into the nuts and bolts of calculating Bollinger Bands.
Decoding Bollinger Bands: Calculation Made Simple:
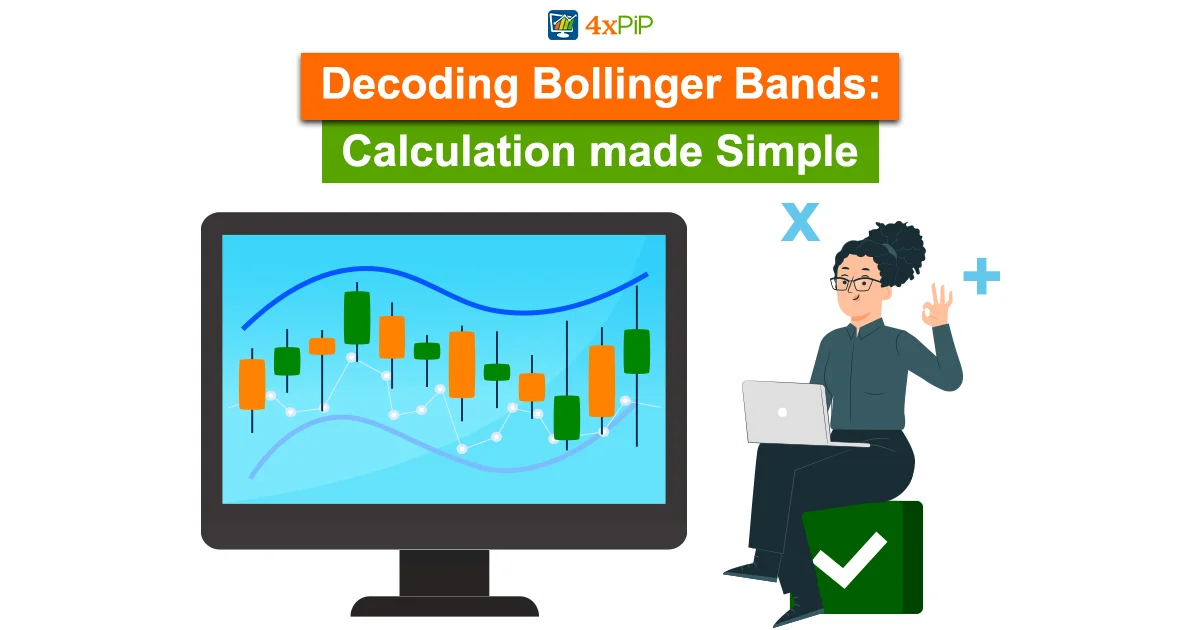
Calculating Bollinger Band involves three lines on a price chart. The first line represents the SMA of an asset’s price, typically over 20 days. The upper band equals the SMA plus two standard deviations, while the lower band is the SMA minus two standard deviations. This calculation empowers traders to interpret market trends confidently.
Bollinger Band MT5:
Bollinger Band MT4:
Interpreting Bollinger Bands: Insights for Traders:
Bollinger Band provides insights into market volatility. Wider bands signal heightened volatility, offering potential opportunities. Conversely, narrower bands suggest a more stable market. Traders observe Bollinger’s ‘squeezes’ and ‘bounces’ as indicators of support and resistance. ‘Squeezes’ hint at an imminent price breakout, while ‘bounces’ may signal an upcoming retracement.
Pros of Bollinger Bands:
- Instrumental in identifying trends.
- User-friendly, enhancing chart analysis.
- Visual representation of market dynamics through band widening/narrowing.
Cons of Bollinger Bands:
- Lagging indicators following market movements.
- Signals may not surface until a price movement is underway.
- John Bollinger advises using them with other technical analysis forms for a comprehensive approach.
Conclusion: Elevate Your Trading with Bollinger Bands and 4xPip:
In conclusion, integrating Bollinger Band into your trading strategy enhances your ability to navigate the market’s complexities. At 4xPip, we are committed to providing accessible knowledge and tools for traders. Explore our range of Expert Advisors, indicators, and automation options for a seamless trading experience. For further guidance, contact our experts at [email protected]. Elevate your trading journey with 4xPip – where expertise meets innovation.