Learn about Bollinger Bands, a helpful tool in trading. These bands show how a stock’s price goes up and down. In this guide, we explain the three lines of Bollinger Band and how they react to market changes. We cover everything from their creation to five simple trading strategies. Take your trading skills up a notch with the Bollinger Bands EA of MT4 and Bollinger Bands EA of MT5 from 4xpip, which automates the reversal strategy. We also touch on other strategies like RSI, options trading, moving average, MACD, and price action, giving you the knowledge to make smart trading decisions. For more help, visit our website 4xpip or email us at [email protected].
What are Bollinger Bands?
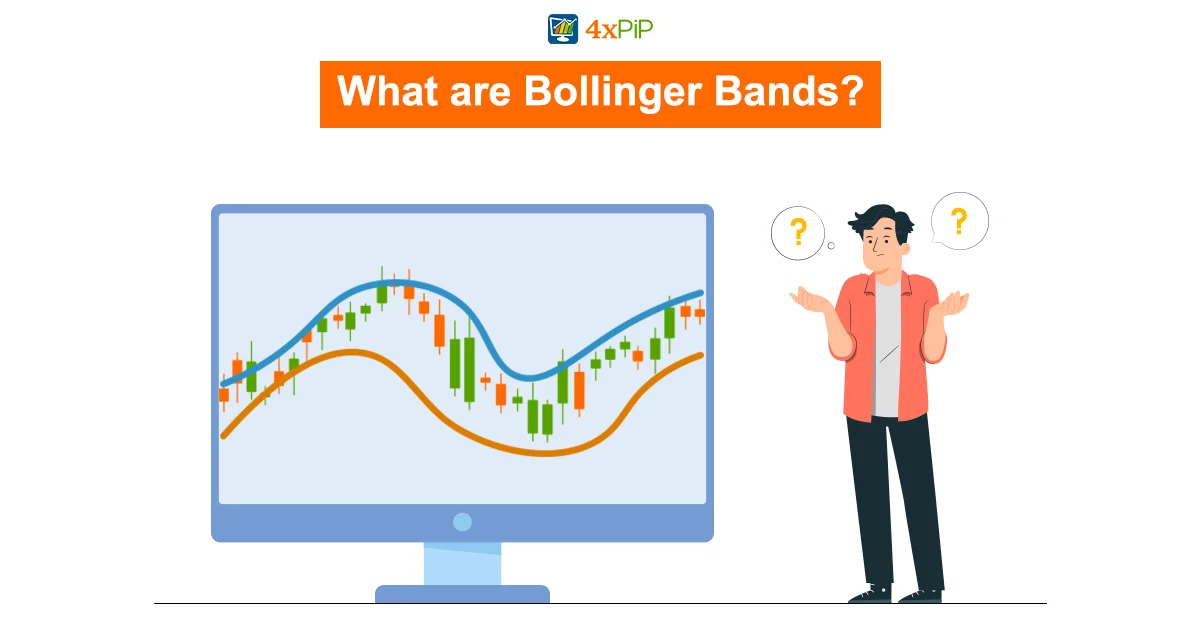
Bollinger Bands are a tool used in analyzing stocks. Created by John Bollinger in the 1980s, they help measure how much a stock’s price goes up and down compared to past trades.
There are three lines: one above, one below, and one in the middle (which is an average). These lines change size based on how much the stock’s price is moving. They get wider when prices are changing a lot and narrower when things are calm. The top and bottom lines show when the price is considered too high or too low, and the middle line helps show the overall trend.
How to Trade with Bollinger Bands?
- Reversals:
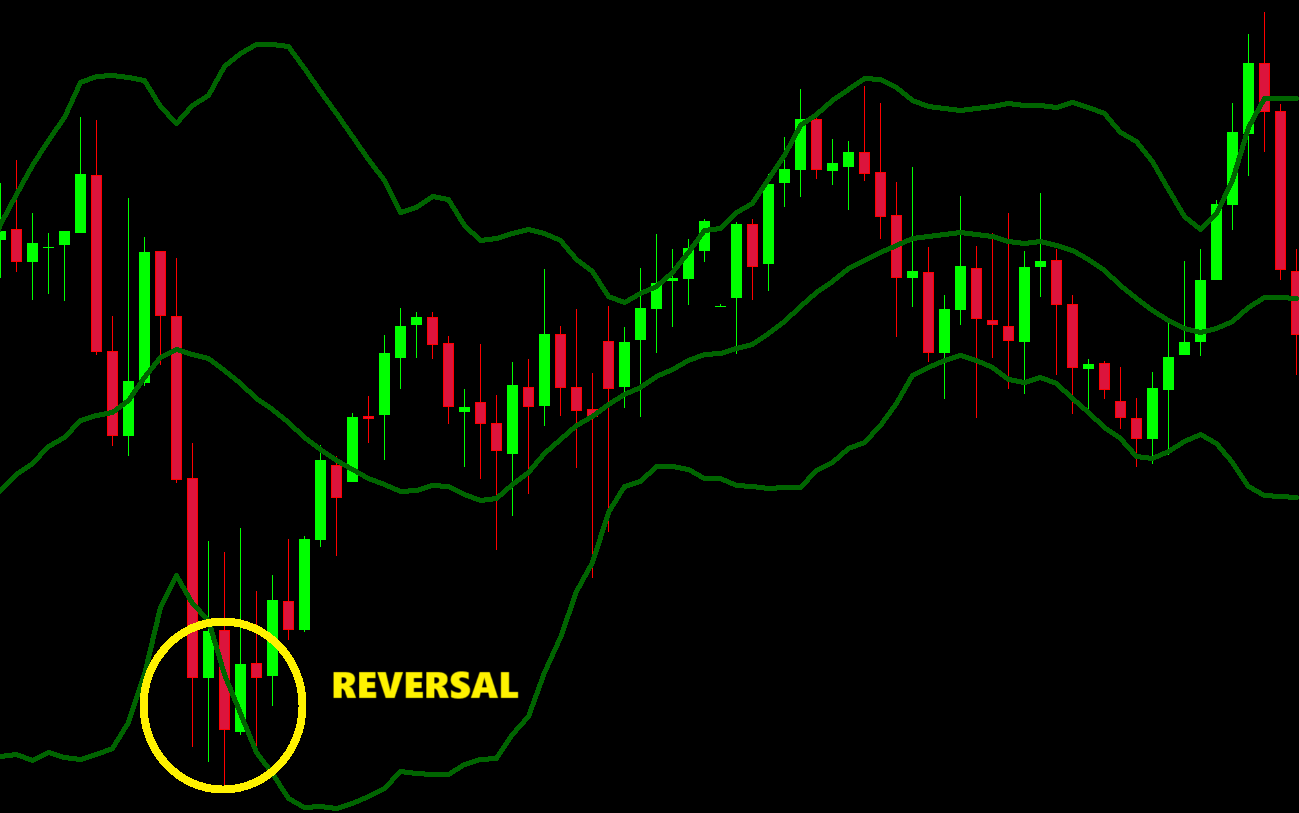
Selling stocks when they go below a certain point works well. Watch candlestick patterns for better results. Check if stocks are above or below certain levels. If they close near the lower limit, they might go up again. Decide whether to sell when they are at upper, middle, or lower limits, based on support levels. This strategy counts on prices going back to average. Keep an eye on candlestick patterns at limits to see if the trend might change. If you see a doji or bearish engulfing pattern near the upper limit, it could be a sign to sell.
Get help with using the Bollinger Bands EA of MT4 and Bollinger Bands EA of MT5 from 4xpip for this strategy. The EAs do the reversal strategy automatically by making trades when it sees signals from Bollinger Band. They buy when the price is near the lower band and sell when it’s close to the upper band, just like the reversal strategy suggests.
- Double Bottoms:
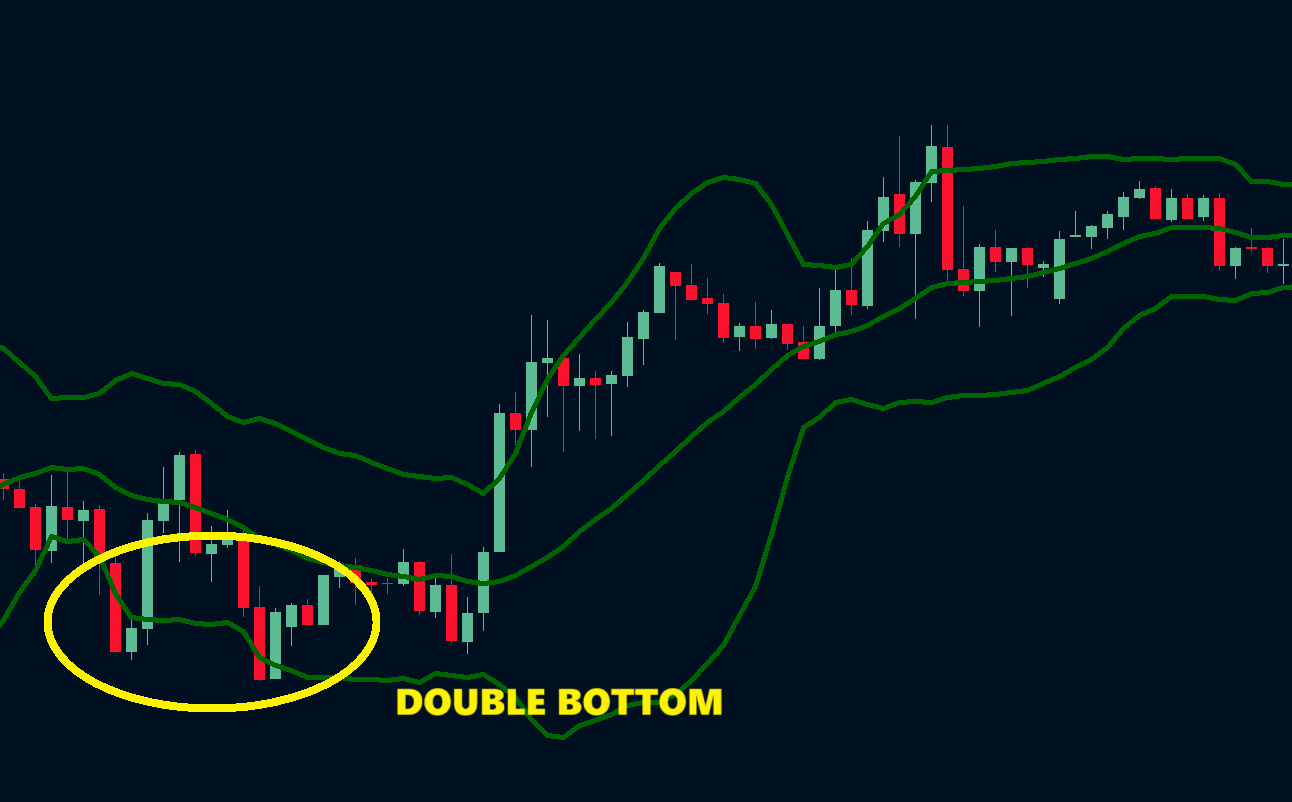
One way to use Bollinger Band is to look for double bottoms after a big price drop with lots of trading. When the price goes below the lower band and then bounces back up, it might go up quickly and hit a resistance level. If, during the retest, there’s less trading activity, it could mean more people are buying instead of selling, suggesting a possible change in the trend.
- Riding the Bands:
Don’t sell when prices are high and buy when they’re low. Wait for prices to get closer before a big change. When the bands are tight, it means prices aren’t moving much. When there’s a breakout with a lot of trading, it could mean a chance to make money. This strategy looks for times when prices are stable before a big move, giving smart traders a chance to profit.
Improve your plan using the Bollinger Bands EA of MT4 and Bollinger Bands EA of MT5. It helps you get in and out at the right times to make more money. The EAs automatically spot the best times to start a new trend, so you won’t miss out on making profits.
Bollinger Bands EA of MT4:
DOWNLOAD NOWBollinger Bands EA of MT5:
DOWNLOAD NOW- Bollinger Band Squeeze:
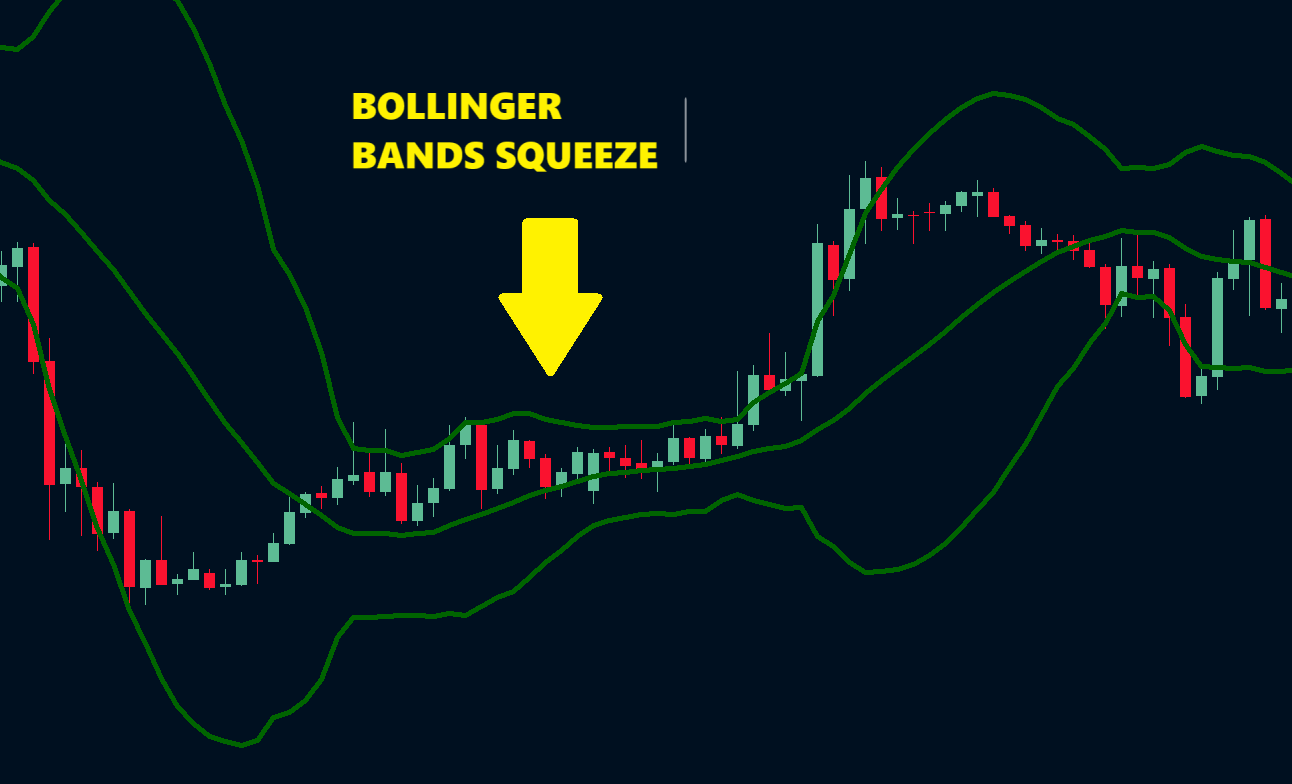
Keep an eye on the daily charts to spot when an indicator is at its lowest in the last six months, as it might mean more price swings. Pay attention to things like more trading or more assets being collected, which could indicate a potential sudden price jump. The Bollinger Band Squeeze strategy makes money when prices stay steady before big changes. Traders expect a squeeze when Bollinger Bands are at their lowest in six months, suggesting energy is building up for a big move. If other indicators, like higher trading volumes or more assets being collected, also show the same thing, it adds more weight to the prediction. Be ready for opportunities when volatility goes up during these times.
- Middle Bands:
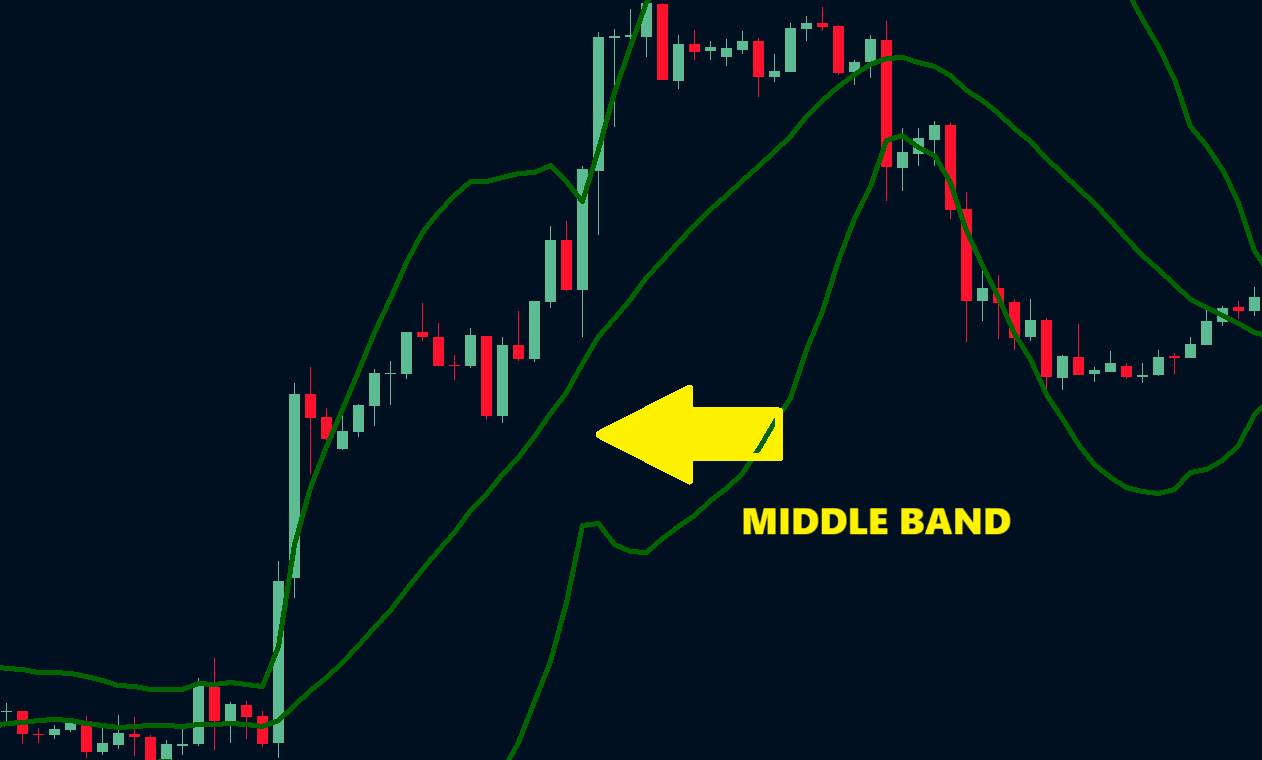
Use a 20-period moving average as a safety net when stocks go down. If it stays unbroken, the stock might be getting weaker, so think about selling.
Try the Middle Bands strategy with a 20-period SMA as a safety net when stocks dip. Think about getting more stocks when the price is close to this level, expecting it to bounce back. Be careful if the stock doesn’t go above the safety net; it could mean a weakening trend. Reassess and sell if needed.
Boosting Profits with Bollinger Bands:
Traders use Bollinger Bands to time their trades. They buy when the price is below the bottom band, indicating overselling, and sell when it’s above the top band, indicating overbuying. However, using Bollinger Bands alone might not be enough. Traders often combine them with other indicators or chart patterns for confirmation. To maximize profits, they look for confirmation signals, like a bullish reversal pattern, when the price hits the bands.
Considering the overall trend and market sentiment is important for making trades that align with the market, increasing the chance of making a profit. Setting stop loss and take profit levels with Bollinger Bands involves thinking about the typical price fluctuations and the specific characteristics of the asset being traded. Traders may place stop loss orders just outside the bands to protect against unexpected price changes. Take profit levels can be based on historical price movements or significant support/resistance levels.
The lot size is closely tied to risk management. Traders decide the trade size as a percentage of their total capital, taking into account the distance to the stop loss level. This approach ensures that each trade carries a manageable level of risk, keeping consistency in the trading plan over time.
Bollinger Bands Strategies:
RSI Strategy:
Bollinger Bands and RSI work together to spot good deals and check how strong prices are. If prices are weak above the upper bands, there might be a drop coming. On the flip side, if there’s strength near the lower bands, prices could go up.
The RSI Strategy makes Bollinger Band even better by adding the Relative Strength Index, which measures how fast prices are changing. Traders can figure out if a trend is about to change or continue by looking at the differences between RSI and Bollinger Band. If prices are above the upper bands and RSI is weak, it might mean a drop is coming. On the other hand, if RSI is strong near the lower bands, prices might go up.
The Options Trading Strategy:
Bollinger Bands are great for trading options, especially in uncertain markets. Traders use them to find trends during times of low volatility. The Bands show potential price changes when they are close together. This helps traders choose the right options strategy, like long straddles or strangles when the market is wild, and short straddles or strangles when it’s calm. So, Bollinger Band help traders make smart decisions in options trading.
Moving Average Strategy:
This strategy uses a 200-day Simple Moving Average (SMA) to understand a stock’s trend. If the stock price is above the SMA, it suggests an upward trend, and if it’s below, it may indicate a possible downward trend.
To analyze the overall trend, the strategy combines Bollinger Bands with the 200-day SMA. When the price is above the SMA, traders may consider ‘buy’ signals, indicating an uptrend. On the other hand, if the price is below the SMA, traders might look for ‘sell’ signals, suggesting a potential downtrend.
By combining these indicators, the strategy helps traders make more informed decisions by considering a broader market perspective.
MACD Trading Strategy:
Combining Bollinger Bands and MACD helps us watch for when MACD crosses under the histogram, giving us a better view of the market. The MACD Trading Strategy combines the strengths of Bollinger Bands and MACD. When MACD crosses under the histogram, it signals potential changes in the trend. By using MACD to track trends and Bollinger Bands to focus on volatility, we can identify important moments in the market for making informed trading decisions. Use the Moving Average Convergence Divergence (MACD) indicator together with the Bollinger Bands EA of MT4 and Bollinger Bands EA of MT5 to find important moments in the market.
Price Action Strategy:
For a simple way of trading, use the Price Action strategy with Bollinger Band. Just wait for the price to touch the upper or lower bands of the envelope. Look for a Price Action signal, like a morning star candlestick pattern, to confirm a potential reversal. This strategy relies on understanding price movements and candlestick patterns, skipping the use of complicated indicators. It’s a clear and straightforward method for making trading decisions.
Summary:
Learn how to improve your trading success with Bollinger Bands, a tool that analyzes stock price movements using three lines. Discover five simple strategies for different trading styles, like reversals, double bottoms, riding the bands, Bollinger Band squeeze, and middle bands. The Bollinger Bands EA of MT4 and Bollinger Bands EA of MT5 from 4xpip automates the reversal strategy to optimize entry and exit points. Combine Bollinger Bands with other indicators like RSI, options trading, moving average, MACD, and price action for better-informed decisions. Get more guidance on 4xpip‘s website or contact them at [email protected].
FAQ’s
What are Bollinger Bands, and how do they work?
Bollinger Bands are a tool for analyzing stocks, indicating price volatility by using upper, lower, and middle lines. They widen during high volatility and narrow during calm periods.
Who created Bollinger Bands?
Bollinger Bands were created by John Bollinger in the 1980s.
How does the Bollinger Bands EAs from 4xpip enhance trading strategies?
The Expert Advisors automate the reversal strategy, executing trades based on signals from Bollinger Bands, optimizing entry and exit points.
What is the Double Bottoms strategy with Bollinger Bands?
This strategy involves identifying a double bottom pattern after a significant price drop, suggesting a potential trend reversal.
Explain the Riding the Bands strategy?
This strategy advises waiting for price stability before a significant move, helping traders identify opportune moments for profit.
What is the Bollinger Band Squeeze strategy, and when is it applicable?
The strategy profits from stable prices before significant changes, especially when Bollinger Bands are at their lowest in six months, indicating potential energy buildup.
How does the Middle Bands strategy work with a 20-period SMA?
The strategy uses a 20-period Simple Moving Average as a safety net, indicating potential trend changes when stocks dip.
How do traders use Bollinger Bands for timing their trades?
Traders buy when the price is below the bottom band (indicating overselling) and sell when it’s above the top band (indicating overbuying).
Why is it recommended to combine Bollinger Bands with other indicators or chart patterns?
Combining with other indicators provides confirmation signals, enhancing the accuracy of trades. Traders often look for bullish reversal patterns when the price hits the bands.
What role does risk management play in Bollinger Bands strategies?
Risk management involves determining the trade size as a percentage of total capital and placing stop loss orders outside the bands to protect against unexpected price changes, ensuring consistent risk levels in the trading plan.


