In this article, 4xPip is providing in-depth knowledge about short-term trading for beginners that are eager to start trading. Don’t miss out the information and do take advice from 4xPip’s experts. You can also check their products and robots for auto trading. 4xPip is one of the best websites to provide trading tools and robots.
What is Short-Term Trading?
In short-term trading, traders buy and sell assets within a short period of time, typically days, weeks, or even hours. This type of trading is very profitable, but it also carries a high degree of risk.
To be successful at short-term trading, you need to understand the risks and rewards of each trade, and you need to be able to spot good short-term opportunities. You also need to protect yourself from losses.
Step 1: Understand Moving Averages:

A moving average is a technical indicator that smooths out price data through calculation of the average price over a specific period of time. The most common time frames for moving averages are 15, 20, 30, 50, 100, and 200 days.
Moving averages are used to identify trends in the price of a stock. A rising moving average indicates that the stock is trending upward, while a falling moving average indicates that the stock is trending downward.
It also identifies potential entry and exit points for trades. For example, if you are looking to buy a stock, you might wait for the moving average to cross above the price of the stock. If you are looking to sell a stock, you might wait for the moving average to cross below the price of the stock.
Step 2: Market Cycles or Patterns:
The stock market tends to trade in cycles, with periods of gains followed by periods of losses. These cycles can last for months or even years.
One of the most well-known market cycles is the January effect. This is the tendency for stocks to perform well in January, after a period of weakness in December.
Another well-known market cycle is the seasonal effect. This is the tendency for stocks to perform better in certain months of the year, such as November to April.
Traders can use market cycles to their advantage by determining good times to enter long or short positions. For example, if you believe that the market is in a seasonal uptrend, you might want to buy stocks in November or December.
However, it is important to remember that market cycles are not always reliable. There have been times when the market used to buck the trend and performed poorly in the expected months.
Therefore, it is important to use market cycles as one of many factors when making trading decisions. You should also consider other factors, such as the overall economic outlook and the performance of individual stocks.
Step 3: The Importance of Market Trends:
When it comes to trading, it is important to understand the current market trend. The market trend is the direction in which prices are moving over time. It can be either bullish (prices are rising) or bearish (prices are falling).
If the market trend is negative, it is more likely that individual stocks will also trend downward. Therefore, you may want to consider shorting stocks in this situation. Conversely, if the market trend is positive, you may want to consider buying stocks.

Risk Management in Short-Term Trading:
Short-term trading is a high-risk activity, so it is important to take steps to manage your risk. One of the most important things you can do is to use stop-losses.
A stop-loss is an order to sell a stock if it reaches a predetermined price. This helps to limit your losses if the stock price goes against you.
Generally, you should set your stop-loss within 10% to 15% of the price you paid for the stock. This means that if the stock price falls 10% to 15%, your stop-loss will be triggered, and your stock will be sold.
By using stop-losses, you can help to protect your capital and prevent large losses.
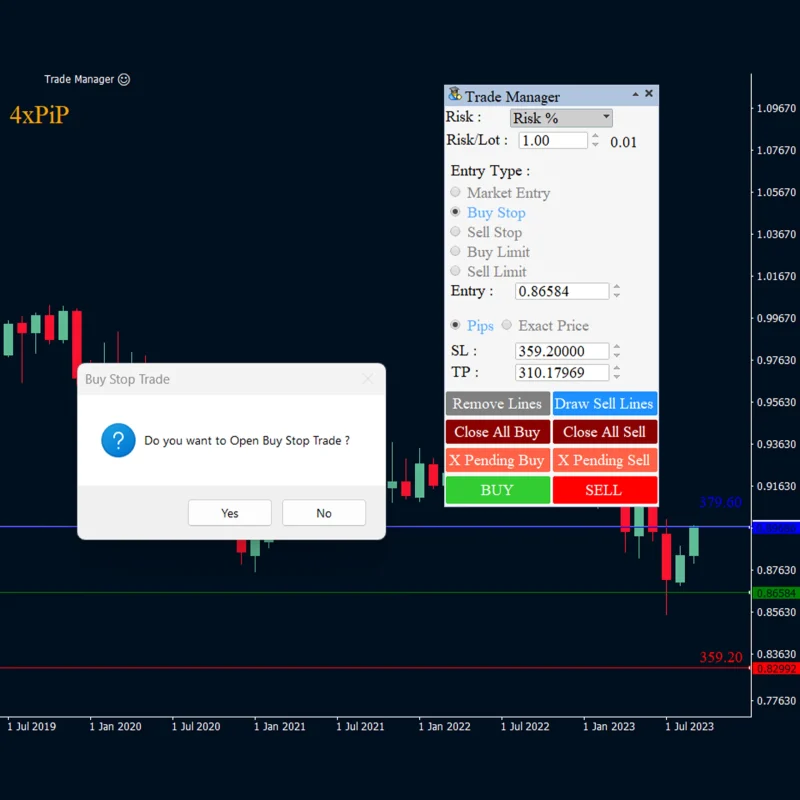
For stop loss you can 4xPip’s products called Stop-Loss MT4 EA and Stop-Loss MT5 EA.
Importance of Technical Analysis:
There is an old saying on Wall Street: “Never fight the tape.” This means that you should not try to trade against the current market trend. The market constantly looks forward and prices in what is likely to happen in the future. This means that we already price everything we know about earnings, company management, and other factors into the stock.
Technical analysis evaluates stocks or markets using previous prices and patterns to predict what will happen in the future. We can use this information to identify trends and patterns in the market, which can help us make better trading decisions.
In short-term trading, technical analysis is an essential tool for identifying potential trades and managing risk. Understanding the underlying market trends and patterns increases your chances of success.
Technical Indicators for Short-Term Trading:
Technical indicators are tools that are used to analyze historical price data to identify trends and patterns. These indicators are helpful for investors to make better trading decisions.
The relative strength index (RSI) and the stochastic oscillator are two of the most popular technical indicators for short-term trading.
Relative strength index (RSI):

The RSI compares the relative strength or weakness of a stock compared to other stocks in the market. A reading of 70 or above indicates that the stock is overbought, while a reading of 30 or below indicates that the stock is oversold.
Stochastic Oscillator:

The stochastic oscillator is used to determine whether a stock is expensive or cheap based on the stock’s closing price range over a period. A reading of 80 or above indicates that the stock is overbought, while a reading of 20 or below indicates that the stock is oversold.
It is important to note that technical indicators are not foolproof. They are based on historical data, and the future is not always predictable. Therefore, you should always use technical indicators in conjunction with other factors, such as fundamental analysis and your own judgment, when making trading decisions.
Chart Patterns for Short-Term Trading:
Chart patterns are recurring price formations that can be used to identify potential trading opportunities. These patterns develop over a few days, weeks, or even months. While no two patterns are the same, they can be used to predict future price movements.
Some of the most important chart patterns for short-term trading include:
- Head and shoulders pattern:

The head and shoulders pattern is a reversal pattern that is often seen when a stock is topping out. The shoulders are usually about the same height, and the neckline is the horizontal line that connects the lows of the two shoulders.
- Triangle pattern:

A triangle pattern is a consolidation pattern that can either be bullish or bearish. It is characterized by a narrowing of the price range between the highs and lows. The triangle can be ascending, descending, or symmetrical.
- Double top pattern:

The double top pattern is a reversal pattern that is formed when prices reach a certain level twice but fail to break through it on the second attempt. This pattern signals that the trend may be changing from bullish to bearish.
- Double bottom pattern:

The double bottom pattern is the opposite of the double top pattern. It is formed when prices fall to a certain level twice but fail to break through it on the second attempt. This pattern signals that the trend may be changing from bearish to bullish.
It is important to note that chart patterns are not always reliable. They are based on historical data, and the future is not always predictable. Therefore, you should always use chart patterns in conjunction with other factors, such as fundamental analysis and your own judgment, when making trading decisions.
Summary:
Short-term trading is a high-risk, high-reward activity. To be successful, it is important to understand the risks and rewards of each trade, and to be able to spot good short-term opportunities. You also need to be able to protect yourself from losses.
Here are some tips for successful short-term trading:
- Understand moving averages. Moving averages are a technical indicator that can be used to identify trends in the price of a stock.
- Use market cycles and patterns to your advantage. The stock market tends to trade in cycles, with periods of gains followed by periods of losses. You can use these cycles to determine good times to enter long or short positions.
- Identify the market trend. The market trend is the direction in which prices are moving over time. It can be either bullish (prices are rising) or bearish (prices are falling). If the market trend is negative, it is more likely that individual stocks will also trend downward. Therefore, you may want to consider shorting stocks in this situation. Conversely, if the market trend is positive, you may want to consider buying stocks.
- Use stop-losses to manage your risk. A stop-loss is an order to sell a stock if it reaches a predetermined price. This helps to limit your losses if the stock price goes against you.
- Use technical analysis to identify potential trades and manage risk. Technical analysis is the process of evaluating and studying stocks or markets using previous prices and patterns to predict what will happen in the future.
-
Utilize chart patterns to identify potential trading opportunities. Chart patterns represent recurring price formations that traders can employ to forecast future price movements.
It is important to note that short-term trading is not for everyone. It is a risky activity, and it is important to have a good understanding of the market before you start trading.

