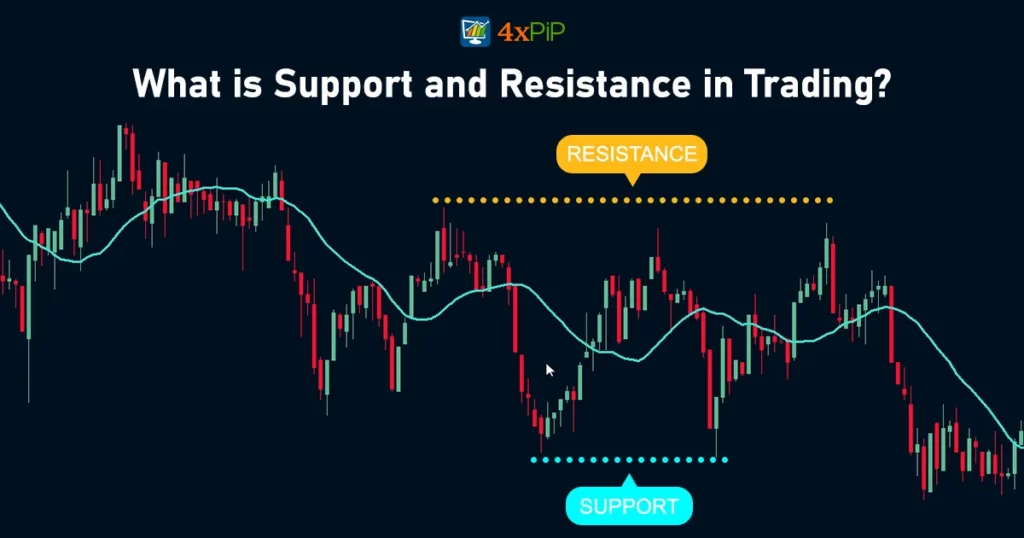
Knowing about support and resistance is important for traders in the financial markets. In this exploration, we’ll look at what support and resistance mean and why they matter in market movements. We’ll break down these key points on a price chart and talk about how traders use them to make smart decisions and improve their trading strategies. Come along to understand the basics of support and resistance in trading.
What is Support?
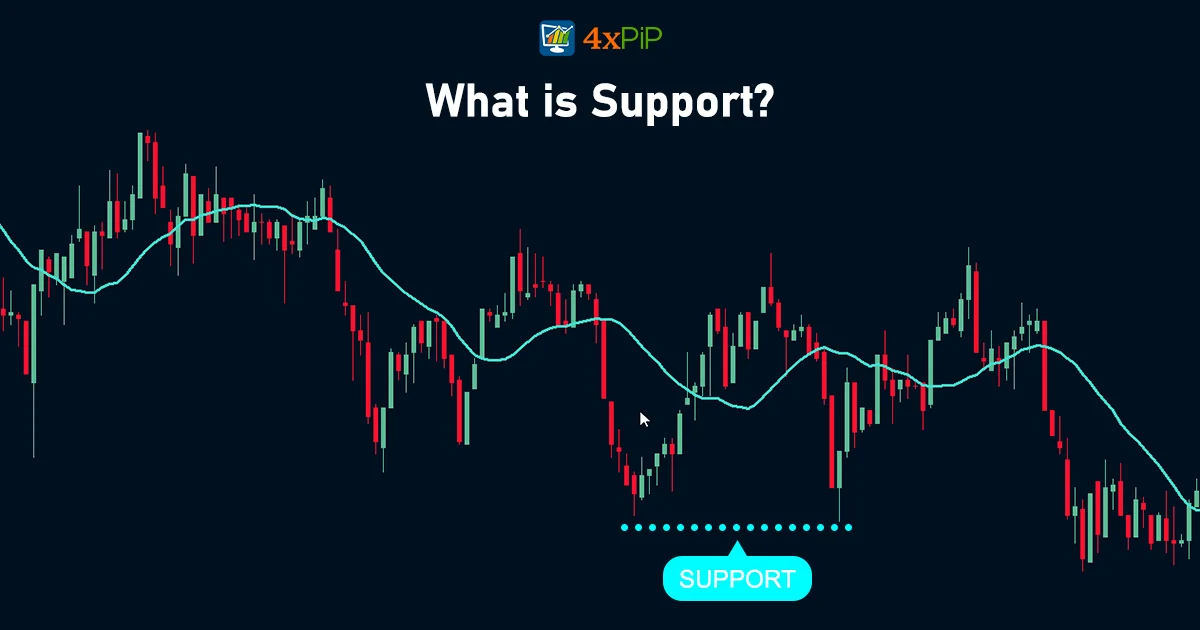
When prices are going down, it’s because there’s more stuff for sale than people want to buy. The lower the prices go, the more appealing they become to folks who were waiting to buy. Eventually, enough people want to buy at these lower prices that it balances out with the amount of stuff for sale. That’s when prices stop dropping – we call this “support.”
Support can be a specific price or a range of prices on a chart. Either way, it’s a point where buyers are ready to jump in. At this level, more people want to buy than sell, so the price stops going down and might even go back up.
What is Resistance?
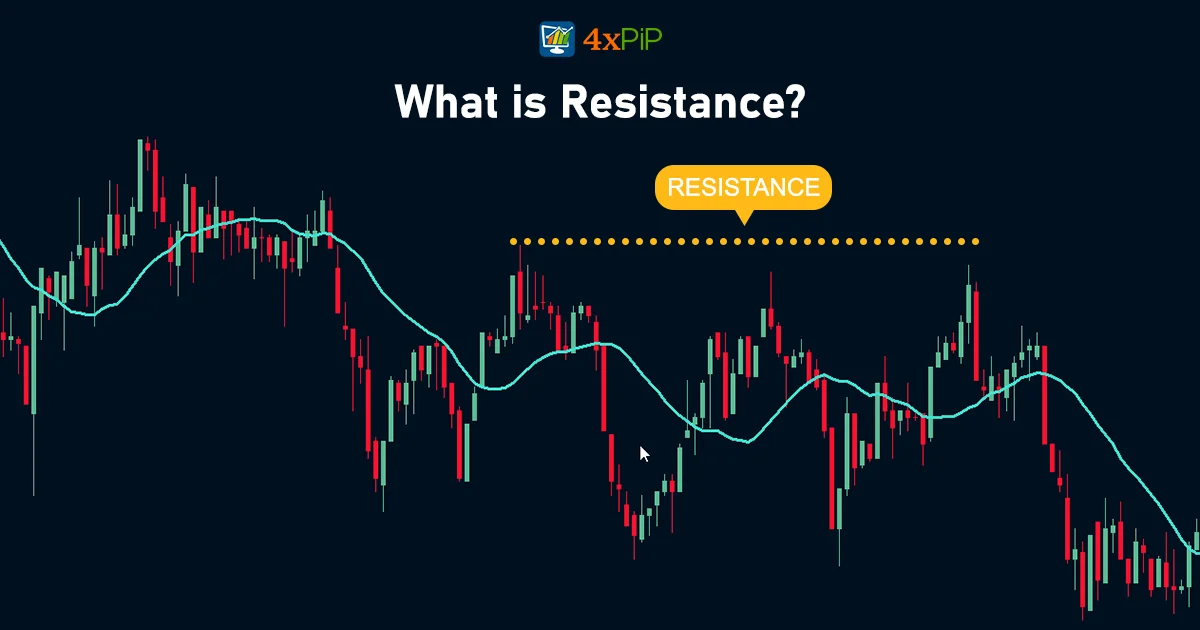
Resistance is when prices stop going up because more people are selling than buying. This can happen because traders think the prices are too high or have reached their target. It might also be because buyers don’t want to buy at such high prices. On a price chart, you can easily see a level where selling becomes stronger than buying – that’s resistance.
Once we identify a support or resistance level, these points can be used for entering or exiting trades. When the price hits a previous support or resistance level, it will either bounce back or break through and continue in the same direction until it reaches the next support or resistance level.
Some trades are timed based on the idea that support and resistance levels won’t be broken. Traders make predictions about whether the price will bounce off or break through these levels. If they’re right, the move can be significant. If they’re wrong, the position can be closed with a small loss.
Support and Resistance Reversals:
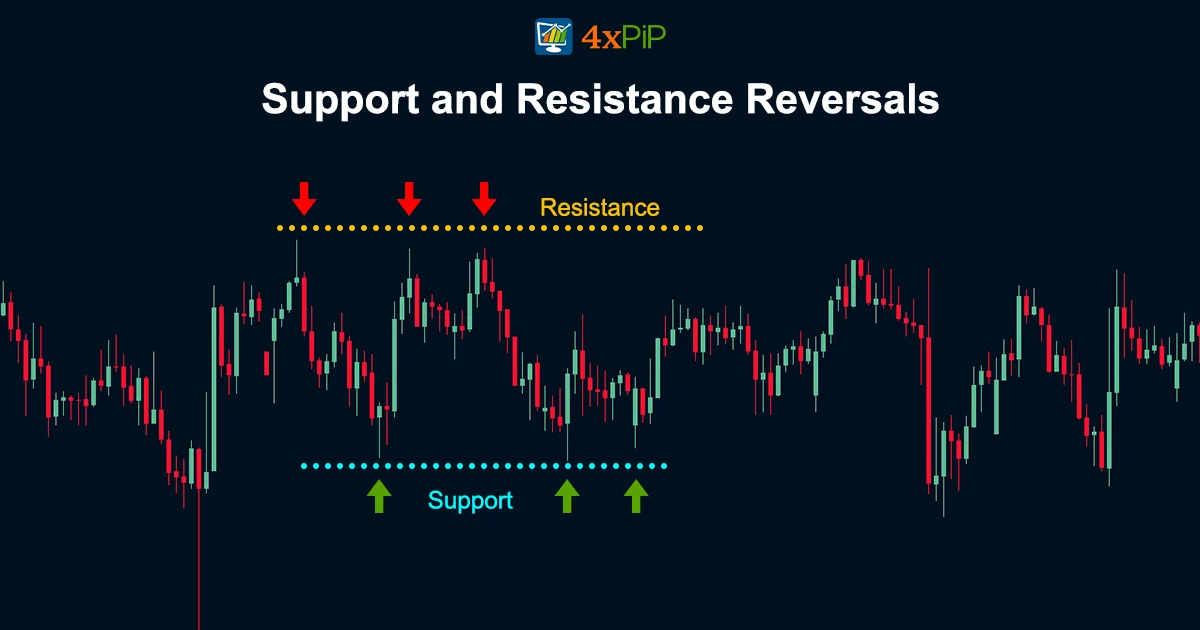
When the price of something tries to go up again, a previous level where it got support can act like a barrier, making it harder to go up. On the flip side, a level that acted as a barrier before might become a support when the price falls temporarily.
People who trade and invest use price charts to see where these support and resistance levels are. They pay attention to:
Number of Times: The more often the price hits a support or resistance level, the more important it is. When prices keep bouncing off a level, more people notice, and it affects their trading decisions.
Previous Price Movement: Support and resistance levels matter more if they follow big price changes. A sudden rise or fall gets more attention and may be stopped by a stronger resistance level compared to a slow and steady movement.
Trading Activity at Certain Prices: If a lot of buying or selling happened at a specific price, that level becomes a stronger support or resistance. Traders remember these levels and use them again. When there’s high activity and the price drops, people are likely to sell when it comes back to that level.
Time Frame: Support and resistance levels on longer-term charts (like weekly or monthly) are usually more important than on shorter-term charts (like one-minute or five-minute).
Moving Averages
Many traders use technical indicators like moving averages to help predict short-term momentum. Instead of drawing trendlines, some prefer using moving averages because they provide a smoother line on the chart. In simple terms, a moving average is a line that shows the average price over a certain period, helping identify support and resistance.
Traders use moving averages in different ways, like predicting upward moves when prices cross above a key moving average or exiting trades when prices fall below it. Regardless of how it’s used, a moving average often creates automatic support and resistance levels. Traders experiment with different time periods for their moving averages to find what works best for their trading.
Supply and Demand Zones:
Supply zones are price levels where a bunch of people want to sell in financial markets. Banks and big money players use fancy computer programs to find these important spots where lots of selling or buying might happen.
When you hear about a supply zone, it means a price where traders usually sell stuff. It’s above the current price, suggesting there’s a good chance people will sell there. When the price hits this level, all the sell orders get filled, and the price goes down. Look at the picture below to see how it works.
In the picture, the price hits a zone and stays there for a bit before going down. This keeps happening until all the sell orders are done.
On the flip side, a demand zone is a price level where traders usually want to buy. It’s below the current price, showing a big interest in buying. The demand zone attracts a bunch of buyers because there are many buy orders at that level. Check out the picture below to get a better idea of what a demand zone looks like.
Conclusion:
To be a successful trader, it’s crucial to understand support and resistance in the financial markets. These are specific price levels or ranges on a chart that have a big impact on market behavior and influence trading decisions. Knowing their importance helps you predict price movements, time your trades well, and improve your overall strategy. As you start trading, 4xpip is your reliable partner, providing expert insights and advanced tools for a smooth trading experience. Check out the resources and products at 4xpip to enhance your trading skills. For assistance, contact our customer support at [email protected]. Elevate your trading with 4xpip – your gateway to success in the finance world.
FAQs
What is Support in trading?
Support occurs when prices attract buyers, balancing the supply-demand equation. It halts the descent of prices, signaling a potential upward movement.
Is Support always a specific price?
Support can manifest as a specific price or a range on a chart. It signifies a level where buying interest surpasses selling pressure.
How does Resistance influence market dynamics?
Resistance emerges when more sellers than buyers are present, impeding upward price movement. It reflects a level where selling strength outweighs buying interest.
Are Support and Resistance levels useful for traders?
Yes, traders utilize these levels to time entries and exits. Prices often react at these points, either bouncing off or breaking through, providing trading signals.
What role do Support and Resistance play in reversals?
Previous support levels can hinder upward movement, acting as barriers. Conversely, previous resistance levels may transform into support during temporary price declines.
Why do traders pay attention to the number of times a level is hit?
The frequency of price hitting a support or resistance level enhances its significance. Repeated bounces off a level influence trading decisions.
How does previous price movement affect the importance of these levels?
Support and resistance levels gain prominence after significant price changes. Sudden rises or falls attract attention, impacting the strength of these levels.
Why is trading activity crucial in determining support and resistance?
Levels where substantial buying or selling occurred become robust support or resistance. Traders recall these levels for future decisions.
What is the relevance of the time frame in support and resistance analysis?
Longer-term charts, like weekly or monthly, hold greater importance in identifying support and resistance compared to shorter-term charts.
How do Moving Averages contribute to support and resistance?
Moving Averages, a popular technical indicator, offer a smoother trendline on charts. They serve as automatic support or resistance levels, aiding traders in predicting market momentum.