A successful trading journey demands a delicate understanding of chart patterns, and among these, continuation and reversal patterns wield significant influence. In this comprehensive guide, we will delve into the complexities of these patterns, empowering traders with the knowledge to decipher market movements and make informed decisions. As you navigate through the wealth of information, consider 4xPip as your trusted ally in the trading realm. Our platform, renowned for providing trading tools, is committed to enhancing your trading experience. Explore our offerings and leverage expert insights to sharpen your trading acumen. For additional support and resources, contact our dedicated customer support at [email protected]. Let’s unlock the mysteries of market trends together and pave the way for your trading success.
Continuation Patterns:
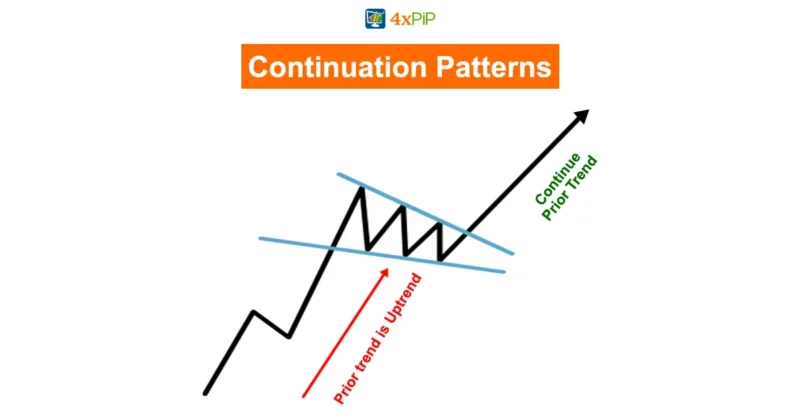
Continuation patterns are indispensable for traders seeking to optimize their positions within existing trends. These patterns indicate a temporary pause or consolidation before the current trend resumes, presenting strategic entry and exit points for traders. Let’s explore some of the most common continuation patterns in detail:
Triangles:
Triangles, encompassing symmetrical, ascending, and descending variations, offer crucial insights into trend continuity. A symmetrical triangle, formed by converging trendlines, signifies market uncertainty, potentially leading to a breakout in either direction. Ascending triangles, with a flat upper trendline and a rising lower trendline, suggest bullish momentum. Conversely, descending triangles, characterized by a flat lower trendline and a descending upper trendline, indicate potential bearish trends. Understanding the nuances of these triangles is essential for anticipating and leveraging trend continuity.
Flags:
Flags, resembling rectangular shapes, are short-lived consolidation patterns that serve as signals of momentum continuation. These patterns are categorized as bullish or bearish, depending on the preceding trend. A bullish flag occurs after an upward price movement, indicating a brief consolidation before the upward trend resumes. Conversely, a bearish flag follows a downward price movement, suggesting a temporary consolidation before the downward trend continues. Identifying and interpreting flag patterns provides traders with a valuable tool for capitalizing on existing market momentum.
Pennants:
Pennants, characterized by small symmetrical triangles, indicate a brief consolidation before the market resumes its prior trend. These patterns are marked by converging trendlines, representing a temporary pause in the market. Recognizing and interpreting pennants is essential for traders looking to anticipate potential breakout or breakdown scenarios. Understanding the dynamics of these patterns equips traders with the ability to make informed decisions during critical market movements.
Rectangles:
Rectangles, as continuation patterns, suggest a temporary consolidation phase where the market moves sideways within parallel support and resistance levels. The formation of rectangles provides valuable information about potential breakout or breakdown points in the market. Recognizing and interpreting rectangle patterns enhances a trader’s ability to execute well-timed trades during periods of market consolidation.
Understanding these continuation patterns is instrumental for traders aiming to optimize their entry and exit points within existing trends. Now, let’s shift our focus to reversal patterns.
Reversal Patterns:
Reversal patterns play a pivotal role in identifying potential shifts in market trends, offering traders a strategic advantage. Recognizing these patterns early on can be a game-changer for traders aiming to capitalize on trend reversals. Let’s explore some of the most common reversal patterns in detail:
Head and Shoulders
Head and shoulder patterns are reliable indicators of a potential trend reversal. Consisting of three peaks – a higher peak (head) between two lower peaks (shoulders) – this pattern signals a shift in market sentiment. The left shoulder represents an initial high, followed by a higher peak (head), and then a lower peak forming the right shoulder. Understanding the anatomy of head and shoulder patterns is essential for traders seeking to identify and capitalize on potential trend reversals.
Double Tops and Bottoms:
Double tops and bottoms are reversal patterns that indicate a potential change in market direction. A double top signals a shift from an uptrend to a downtrend, while a double bottom signals a reversal from a downtrend to an uptrend. Identifying the symmetry and structure of these patterns equips traders with the ability to anticipate trend reversals accurately. Double tops are formed when an asset reaches a peak price, retraces, and then fails to surpass the previous peak. Conversely, double bottoms are formed when an asset reaches a low price, rebounds, and fails to fall below the initial low.
Wedges:
Wedges are patterns that suggest a weakening trend, potentially leading to a reversal. There are two main types: rising wedges and falling wedges. A rising wedge indicates a slowing uptrend, while a falling wedge suggests a slowing downtrend. Recognizing the characteristics of wedges and their implications for market movements enhances a trader’s ability to identify potential reversal points. Rising wedges are formed when both the upper and lower trendlines slope upward. Falling wedges, on the other hand, are characterized by a downward slope in both trendlines.
Summary:
This comprehensive guide explores the intricacies of continuation and reversal patterns, empowering traders with the knowledge to navigate dynamic markets. Delving into common patterns like triangles, flags, head and shoulders, and wedges, the guide provides in-depth insights for recognizing these formations and leveraging them for informed trading decisions. Whether identifying trend continuity or potential reversals, mastering these patterns is crucial for traders seeking success in the world of finance.