In the dynamic world of financial markets, traders and investors employ various tools and techniques to analyze price movements and make informed decisions. Candlestick patterns are a powerful tool in technical analysis, providing valuable insights into market sentiment. Among these patterns, bearish engulfing candlestick is a signal of potential trend reversal, mainly when it occurs after bullish trend. In this article, 4xPip aims to provide comprehensive insights into the bearish engulfing pattern, its meaning, reliability, and engulfing patterns backtesting. If you’re a beginner to trading, it’s advisable to seek guidance from the experts at 4xPip and explore their range of products and auto trading robots. Recognized as one of the premier websites for trading tools and information, 4xPip offers valuable resources to enhance your trading experience.
What Is a Bearish Candlestick Pattern?
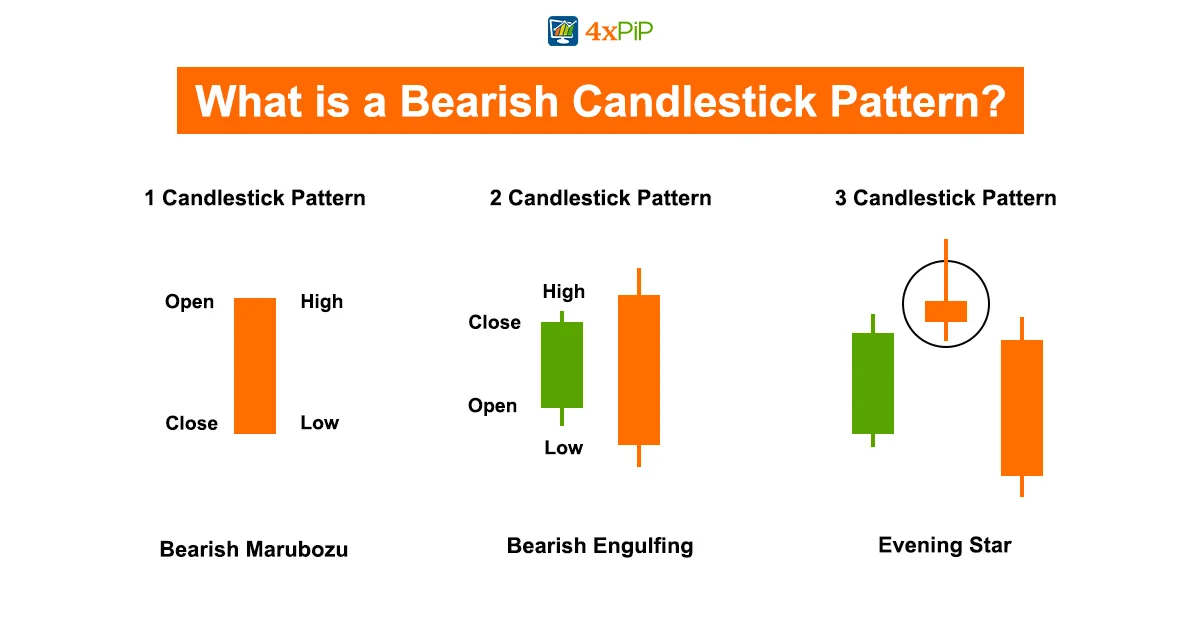
In trading, a bearish pattern refers to a set of price movements and chart formations that traders and analysts use to indicate a potential decline in the value of an asset or security. Technical analysis recognizes these patterns, providing insights into opportunities to sell or short an asset in anticipation of a downward price movement.
A bearish candlestick pattern represents a configuration of candlesticks on a price chart, typically signaling a shift in market sentiment from bullish to bearish. Such patterns are characterized by one or more candlesticks that tend toward lower prices.
One common example of a bearish candlestick pattern is the bearish engulfing pattern. This two-candlestick pattern includes a smaller bullish candle and a larger bearish candle that completely engulfs the previous candle’s body. The bearish candle opens higher than the last candle’s close and closes lower than the previous candle’s open, indicating a reversal in momentum and a potential downturn in the asset’s price.
Definition of Bearish Engulfing Candlestick Pattern:
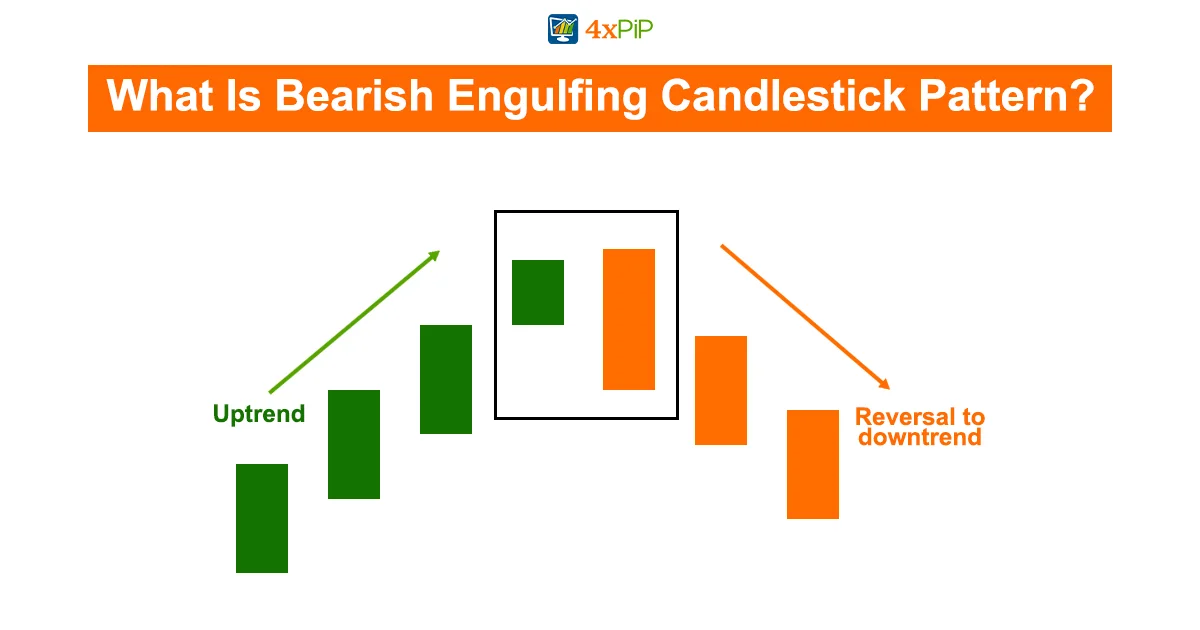
The bearish engulfing candlestick pattern is a reversal pattern in technical analysis that typically occurs at the end of an uptrend. It consists of two candles and is characterized by a small bullish candle followed by a larger bearish candle that completely engulfs the previous candle’s body. Here’s a breakdown of its components:
First Candle (Bullish):
The first candle is relatively small and bullish, indicating buyers are still in control. This candle suggests a continuation of the current trend.
Second Candle (Bearish):
The second candle is larger and bearish, completely covering the first candle’s body. It opens higher than the first candle’s close and closes below the first candle’s open. This candle signifies a decisive shift in sentiment from bullish to bearish.
What Does The Bearish Engulfing Pattern Indicate?
The bearish engulfing pattern typically emerges at the end of upward price movements. This pattern is characterized by a larger second candle, which engulfs or surpasses the first candle, representing upward momentum. This occurrence signals a transition towards lower prices in the market.
Before the Bearish Engulfing pattern, the price must exhibit a clear and established uptrend. The market experiences a gap up, but subsequently, selling pressure emerges, compelling the price to decline significantly. This downward movement is so pronounced that the resulting candle concludes with a close lower than the preceding upward (white or green) candle. The greater the size of the second candle compared to the first, the more pronounced the strengthening of bearish sentiment becomes.
When examining a particular Bearish Engulfing pattern, consider the following:
- A substantial preceding uptrend enhances the effectiveness of the pattern.
- Greater the height of upper shadow and depth of lower shadow of engulfing candlestick’s body, the more robust pattern tends to be.
How To Use a Bearish Engulfing Candlestick Pattern in Forex Trading?
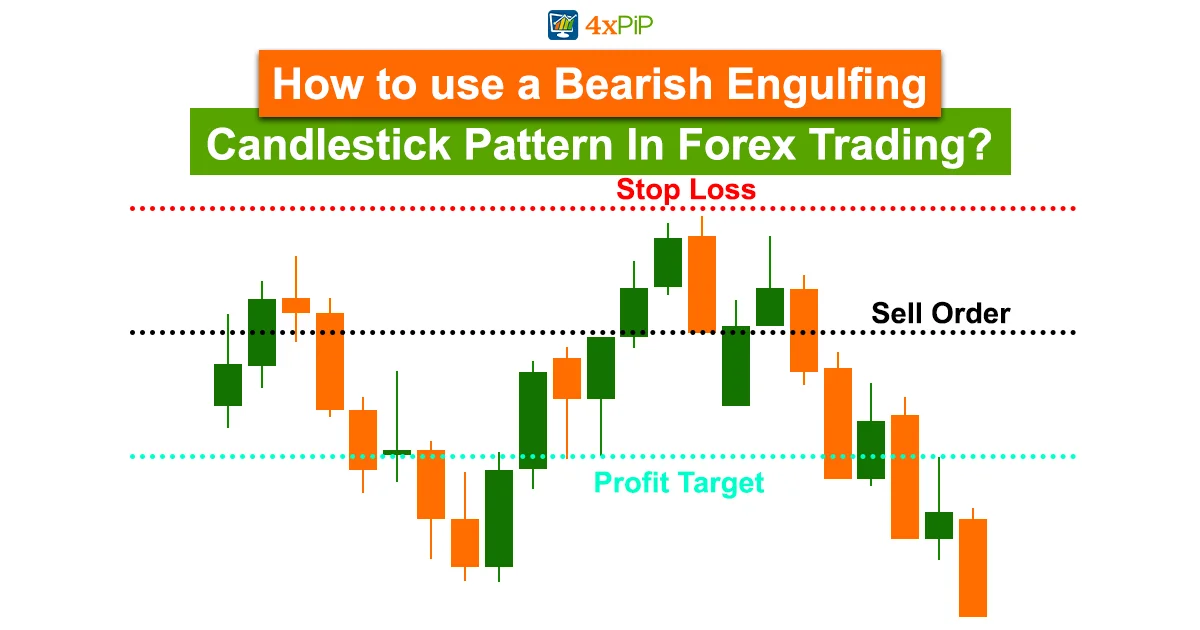
Upon recognizing the bearish engulfing pattern, executing a trading strategy entails three essential steps: defining the market entry, establishing a stop loss, and setting a take profit.
- To identify the market entry using bearish engulfing candles, focus on the second candlestick in the pattern. Once the second candlestick has completed its formation, it’s opportune to place a sell order below the lower extremity of this candle. This action exposes you to potential bearish reversals in the market.
- Identifying a suitable point for a stop loss in the context of a bearish engulfing formation is simple. Position stop losses beyond the upper limit of the pattern. Considering second candle encapsulates both high and low of shape, place your stoploss above high of second candlestick.
- Numerous methods exist for establishing profit targets within the realm of forex trading. Some prevalent approaches include aligning with risk vs. reward ratios, pattern height, or percentage gain. For the bearish engulfing pattern, position profit targets equivalent to the pattern’s height. Therefore, viable profit target is placed below formation, ensuring minimum 1:1 risk vs. reward ratio relative to second candle’s range.
Example:
Bearish Engulfing Pattern: Reversal Signal:
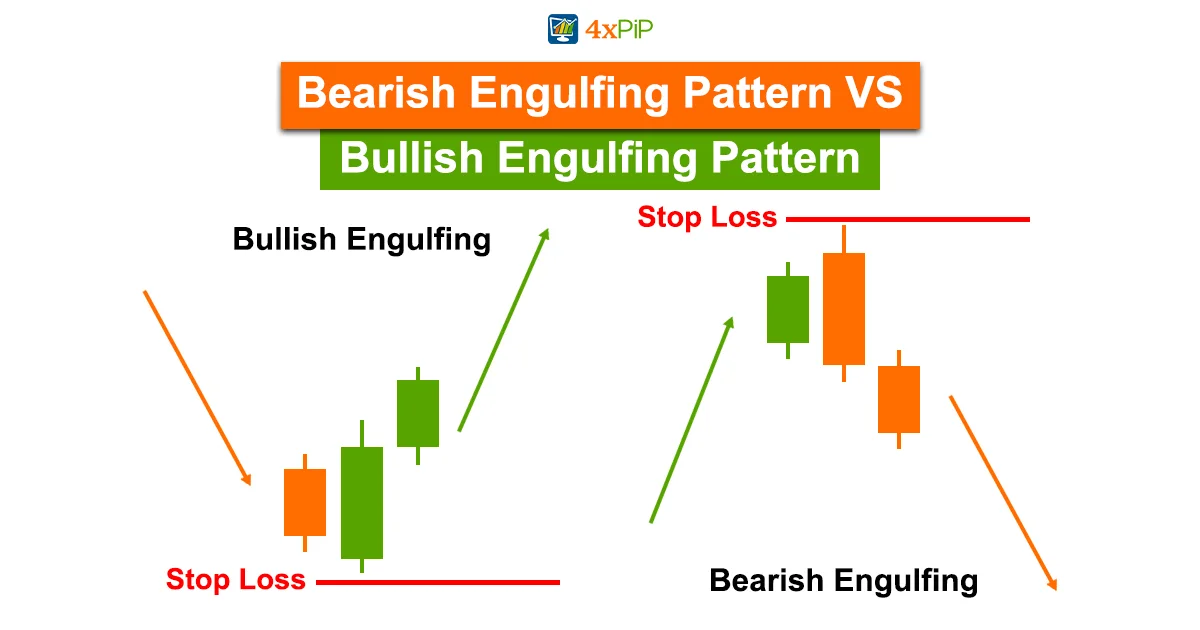
Bearish Engulfing Pattern vs. Bullish Engulfing Pattern:
A sustained decline in investment prices characterizes a bearish market. Bearish market is typically identified when broad market index experiences a decrease of 20% or more from its recent peak. On the contrary, bull market is opposite scenario, marked by increases of 20% or more in the market index.
The bearish engulfing pattern occurs during an uptrend. It is characterized by a smaller bullish candle followed by a larger bearish candle that engulfs the previous candle’s body, suggesting a shift from bullish to bearish sentiment. Conversely, the bullish engulfing pattern unfolds in a downtrend, featuring a smaller bearish candle followed by a larger bullish candle that engulfs the previous candle, indicating a potential reversal from bearish to bullish sentiment.
Traders use these patterns as visual cues for informed decision-making about entering/exiting positions based on changing market dynamics.
How Reliable Is The Bearish Engulfing Pattern?
The bearish engulfing candlestick is a widely recognized and popular pattern, with a noteworthy success rate of 79% in signaling a shift toward bearish market sentiment as a bearish reversal signal.
Enhancing its reliability is crucial when it follows an apparent upward movement. In cases where price action is choppy, numerous engulfing patterns may emerge, but they are less likely to lead to substantial price movements due to overall indecision or a lack of a defined trend in the price action.
Certain conditions make the pattern more reliable, notably when the open price of the engulfing candle significantly exceeds the close of the first candle, and conversely, when the close of the engulfing candle is notably below the open of the first candle. Moreover, the pattern exhibits heightened strength when the downward candle is considerably larger, emphasizing the importance of a substantial shift in market sentiment for increased reliability.
Bearish Engulfing Candlestick Pattern Backtesting:
Traders evaluate the accuracy of a trading strategy by applying it to historical data in a process known as backtesting. Technical traders frequently employ this method to assess the performance of their trading strategies under real-market conditions.
Analyzing historical price data is a key aspect of a bearish engulfing backtest, aiming to assess the effectiveness of the bearish engulfing candlestick pattern as a trading signal. Traders and analysts conduct backtests to evaluate how well a specific trading strategy, in this case, the bearish engulfing pattern, would have performed in the past under various market conditions. Traders can backtest positioning of stop-loss/take-profit for sell trades to find out most optimum levels according to bearish engulfing patterns.
Limitations Of Bearish Engulfing Candlestick Pattern:
Engulfing patterns are effective when observed after clear upward price movement, as pattern vividly indicates momentum shift towards downside. In instances where price action is erratic or characterized by fluctuations, even if the overall trend is upward, the importance of the engulfing pattern diminishes as it becomes a more commonplace signal in such choppy conditions.
Engulfing candle might also be substantial in size, leading to possibility of trader requiring stoploss when choosing to trade pattern. In such cases, the potential reward derived from the trade may not be sufficient to justify the associated risk.
Determining the potential reward can be challenging with engulfing patterns since candlesticks do not offer a specific price target. Traders, therefore, must rely on alternative methods, such as indicators or trend analysis, to choose price target or decide when to exit profitable trade.


