In this extensive guide presented by 4xPip, a reliable provider of trading tools, we will explore the Shooting Star candlestick pattern, its Meaning, and how to trade with it. So, start on your journey with 4xPip as a trader armed with the knowledge of the Shooting Star pattern, and may the markets always be in your favor!
What is a Japanese Candlestick Called?
Before we delve into the specifics of the Shooting Star pattern, let’s first understand the basics of Japanese candlestick patterns. Candlestick charts originated in Japan in the 18th century and have since become a popular tool in technical analysis. These charts provide valuable information about the price movement of an asset over a specific period.
Candlestick patterns consist of individual candles, each representing a particular time frame. These candles are composed of four main components: the open, high, low, and close prices. The body of the candle is filled or hollow, depending on whether the close price is lower or higher than the open price. The upper and lower shadows, also known as wicks or tails, represent the price range between the high and low points. Now that we have a basic understanding of candlestick charts, let’s move on to the Shooting Star pattern.
What does Shooting Star Mean in Candlestick?
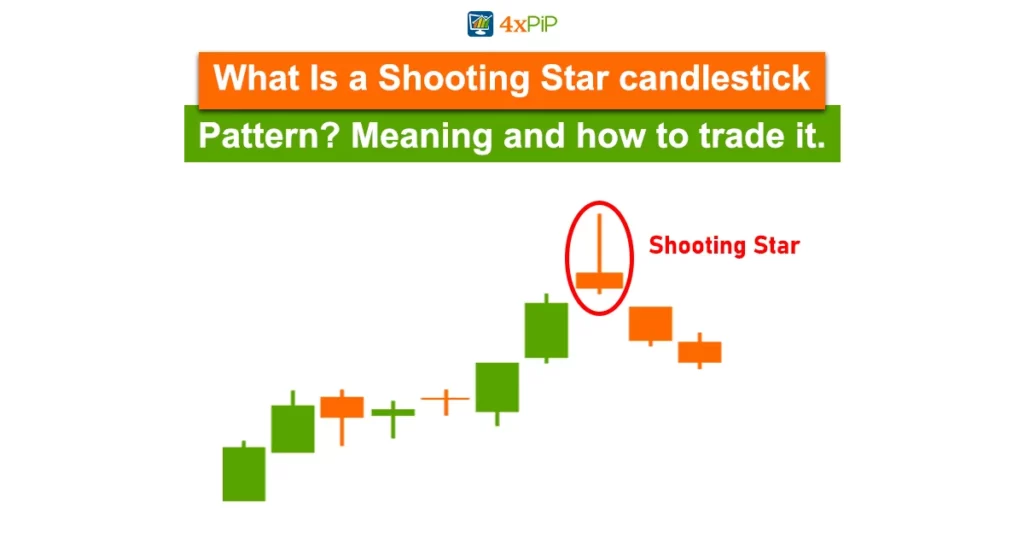
The Shooting Star pattern is a bearish reversal pattern that signals a potential trend reversal from bullish to bearish. It is characterized by a single candle with a small body and a long upper shadow, at least twice the size of the body. The pattern forms when the market opens at or near its high, rallies during the session, but then faces selling pressure, pushing the price down to close near its opening.
Think of a brave rocket shooting up into the sky, trying to touch the highest point but suddenly being dragged down by gravity, falling back to Earth. That’s like the Shooting Star. It’s a pattern that shows up when an uptrend is at its climax, suggesting that things might start going in a different direction.
Traders consider the Shooting Star pattern to be a strong bearish signal, especially when it forms after a prolonged uptrend. It suggests that the buying pressure is weakening and the bears are gaining control, potentially leading to a trend reversal.
What Does the Shooting Star Candlestick Pattern Indicate?
Visually, the Shooting Star pattern resembles a star with a long tail or shadow pointing upwards. This pattern indicates that the bulls (buyers) attempted to push the price higher, but the bears (sellers) stepped in and drove the price down, erasing most of the gains made during the session.
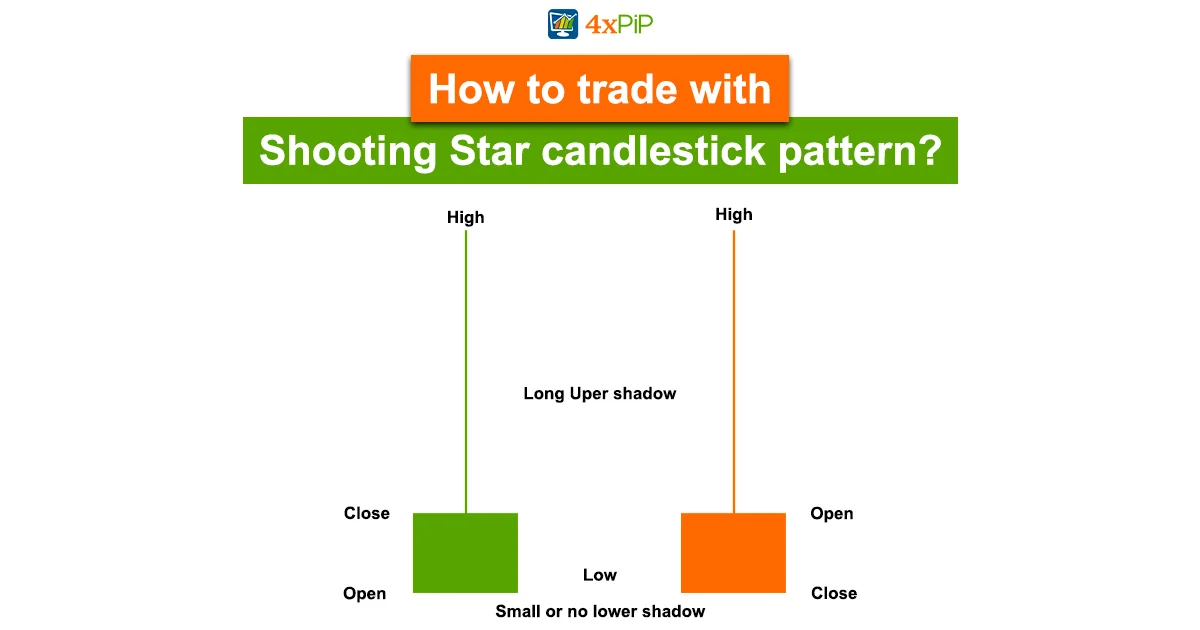
- Long Upper Shadow: This wick stretches dramatically above the candle body, symbolizing bullish hope that was swiftly stopped. Think of it as the rocket reaching for the stars before falling back.
- Small Real Body: Near the bottom of the candle, the real body represents the difference between the open and closed prices. A small real body in a Shooting Star signifies minimal price movement throughout the trading session, suggesting buyers and sellers reached a stalemate.
- Short Lower Shadow: Unlike the ambitious upper wick, the lower shadow remains stubby, indicating minimal selling pressure compared to the bullish uptrend earlier in the day.
This pattern serves as a bearish reversal signal, suggesting a weakening bullish momentum and a potential shift toward a bearish trend. Confirmation from subsequent candles is often sought, and traders may consider short positions in anticipation of a price decline.
How to Trade with Shooting Star Candlestick Pattern?
The shooting star candlestick pattern can be a helpful indicator, but trading based solely on it can be risky. Here’s how to use it strategically:
Identify the context:
- Bullish Shooting Star: Appears at the peak of an uptrend with a small body and long upper shadow. Suggests a temporary pause or potential reversal.
- Bearish Shooting Star: Appears at the bottom of a downtrend with a small body and long lower shadow. Suggests a possible continuation or acceleration of the downtrend.
Look for confirmation:
- Bullish: Wait for price to hold above the shooting star’s body or retrace to a previous support level before entering a long position.
- Bearish: Wait for price to break below the shooting star’s body or close below a previous resistance level before entering a short position.
Combine with other indicators:
- Use technical indicators like moving averages, RSI, or MACD to confirm the trend and potential reversal signals.
- Consider fundamental factors like economic data and news events to understand the broader market sentiment.
Manage your risk:
- Always use stop-loss orders to limit potential losses, regardless of the pattern.
- Don’t over-allocate your capital or security based on a single technical signal.
If you’re looking for a reliable platform with advanced tools and resources to hone your shooting star candlesticks expertise and conquer the Forex market, look no further than 4xPip! offers a user-friendly interface, comprehensive educational materials, and access to a vibrant community of traders. This hands-on approach will equip you with the confidence to wield the shooting star as a powerful weapon in your Forex trading journey on 4xpip!
What is the Price Target for Shooting Star Candlesticks?
In trading, a price target refers to a specific level at which a trader aims to take profits or expects a trade to reach. It is a predefined price level that is based on technical or fundamental analysis. Traders set price targets to manage their risk-reward ratio and make informed decisions about when to exit a trade. The price target is often determined by factors such as support and resistance levels, chart patterns, technical indicators, or fundamental analysis of the asset or security. Setting and achieving price targets is a key aspect of implementing a trading strategy.
Unlike some other chart patterns, the Shooting Star candlestick pattern does not inherently provide a specific price target. Instead, traders often look for confirmation signals in subsequent price action to determine the potential direction of the market. A shooting star is a candlestick pattern that occurs when a security or asset’s price opens, experiences a notable upward movement, but ultimately closes near the opening price. The space between the day’s highest price and the opening price must be at least twice as large as the body of the shooting star.
Typically, after identifying a Shooting Star, traders may observe the next candle or candles to confirm the reversal. If the price continues lower and closes below the low of the Shooting Star, it can be seen as confirmation of the bearish reversal, and traders might consider setting a target based on technical analysis tools like support levels, Fibonacci retracement levels, or other chart patterns.
Is Shooting Star Candlesticks Pattern Bullish or Bearish?
The Shooting Star is a bearish candlestick pattern. It typically appears at the end of an uptrend and suggests a potential reversal in the price direction from bullish to bearish. Its visual characteristics include a small real body near the bottom of the candle, signaling minimal price change during the trading session. The defining feature of the Shooting Star is the long upper shadow (wick) stretching above the candle body, symbolizing the ambitious attempt by buyers to propel the price higher.
However, this ascent is abruptly halted as sellers take command by the end of the trading session, causing the price to retreat. The Shooting Star’s appearance reflects a struggle between bullish and bearish forces, with the eventual triumph of the bears, indicating a potential reversal from a bullish to a bearish trend. Traders often interpret the Shooting Star as a warning sign of weakening upward momentum and an impending shift in market sentiment.
It’s crucial to be aware that certain shooting star candlestick patterns might be misleading. They may appear in green color, indicating that the opening price in the market was lower than the closing price. These are referred to as bullish shooting star candlesticks, also known as inverted hammer candlesticks.
Limitations of Shooting Star Candlestick Pattern:
While the shooting star candlestick pattern can offer valuable insights, it’s not without its limitations. Here are some key drawbacks to keep in mind:
- The shooting star can be ambiguous and prone to false signals. Just because a price stalls after a long shadow doesn’t guarantee a trend reversal. It could simply be a temporary fluctuation before the trend continues.
- Confirmation is crucial. Look for further bearish/bullish signals (depending on the context) in subsequent candlesticks or other technical indicators before acting on the shooting star.
- A single shooting star provides limited information about the market’s overall sentiment and future direction. Consider it a potential signal, not a definitive prediction.
- The reliability of the Shooting Star can vary based on the time frame used for analysis. Traders should be mindful of the time frame they are working with and consider multiple time frames for a more comprehensive view.
Conclusion:
The Shooting Star pattern is a powerful tool in the world of trading. By understanding its visual characteristics and implications, traders can identify potential trend reversals and make informed trading decisions. When incorporated into a broader technical analysis framework, the Shooting Star pattern can significantly enhance the accuracy of trading strategies. With 4xPip as a trusted ally, traders gain access to high-quality, accurate EAs designed with precision. Our VIP customer support further solidifies our commitment to trader success, making 4xPip a valuable partner for those analyzing the trading landscape.
For additional assistance and insights, feel free to contact the experts at 4xPip via email at [email protected].