Traders have long used candlestick patterns as a powerful tool to analyze and predict market trends. Today, In this article by 4xPip, we’re cracking the code of the hammer candlestick pattern, a symbol of hope in the throes of a downtrend. Whether you’re a seasoned investor or a beginner, buckle up as we delve into the meaning, types, and, most importantly, how to trade this powerful market signal. Recognized as one of the premier websites for trading tools and information, 4xPip offers valuable resources to enhance your trading experience.
What is the Hammer Candlestick Pattern in a Downtrend?
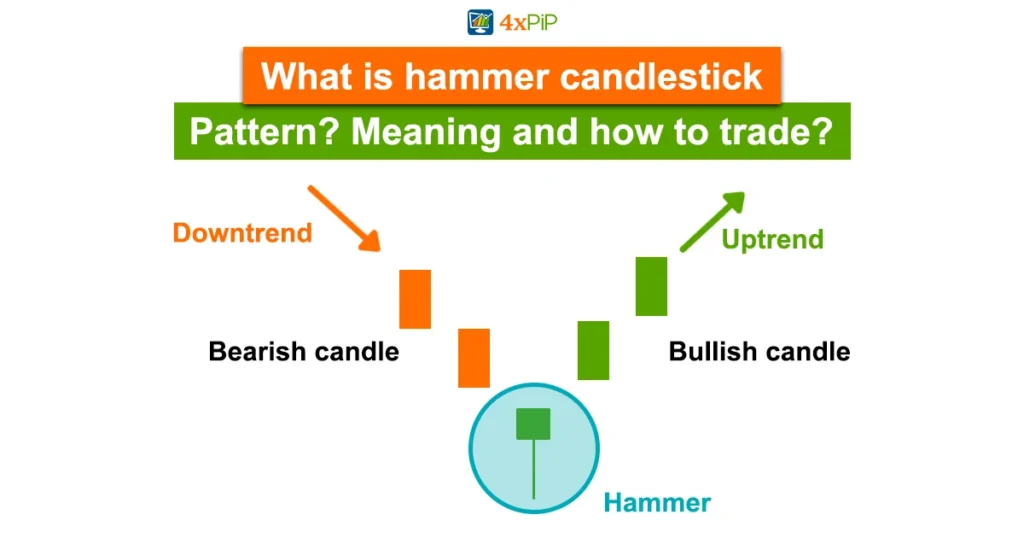
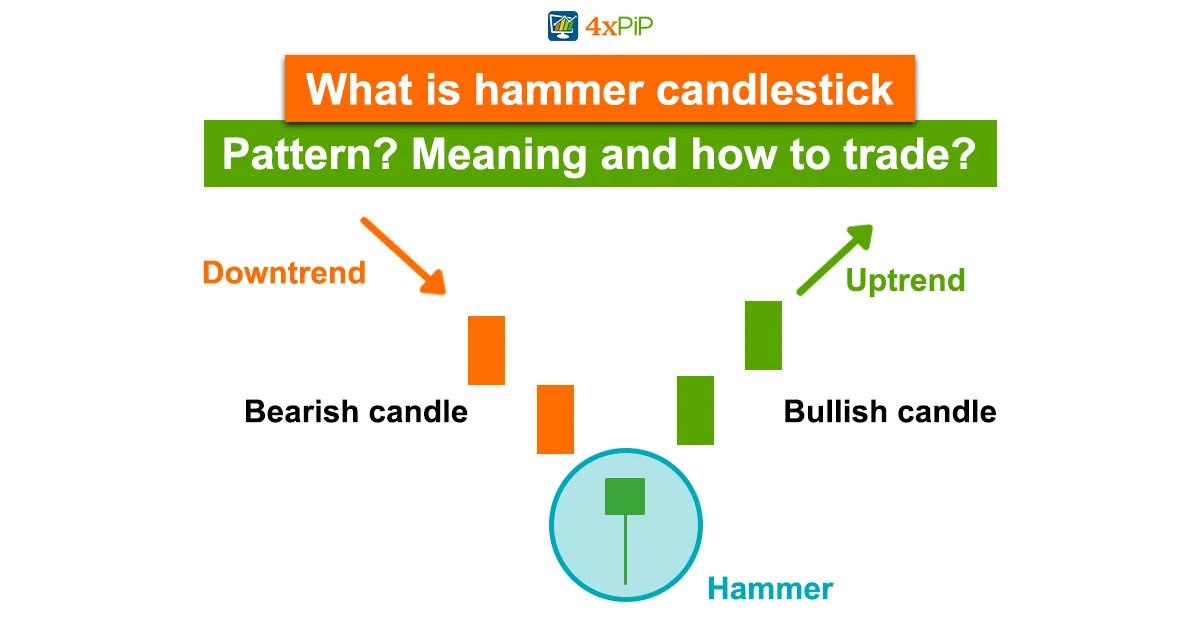
The hammer candlestick pattern is a single candlestick formation that signals a potential reversal in the market. A hammer candlestick, a technical trading pattern resembling a “T,” got its name due to its resemblance to a hammer, consisting of a small body with a long lower shadow and little to no upper shadow. This pattern is especially significant after a downtrend, suggesting a possible change in market sentiment. The hammer candlestick pattern strongly indicates that the bulls are gaining strength and may soon take control of the bears. It suggests that the selling pressure has been exhausted, and buyers are stepping in to increase the price.
Traders often interpret the hammer candlestick pattern as a signal to enter a long or buy position or to close out existing short or sell positions. The pattern is considered more reliable after a downtrend, as it indicates a potential reversal in the price direction.
Formation of Hammer Candlestick Pattern:
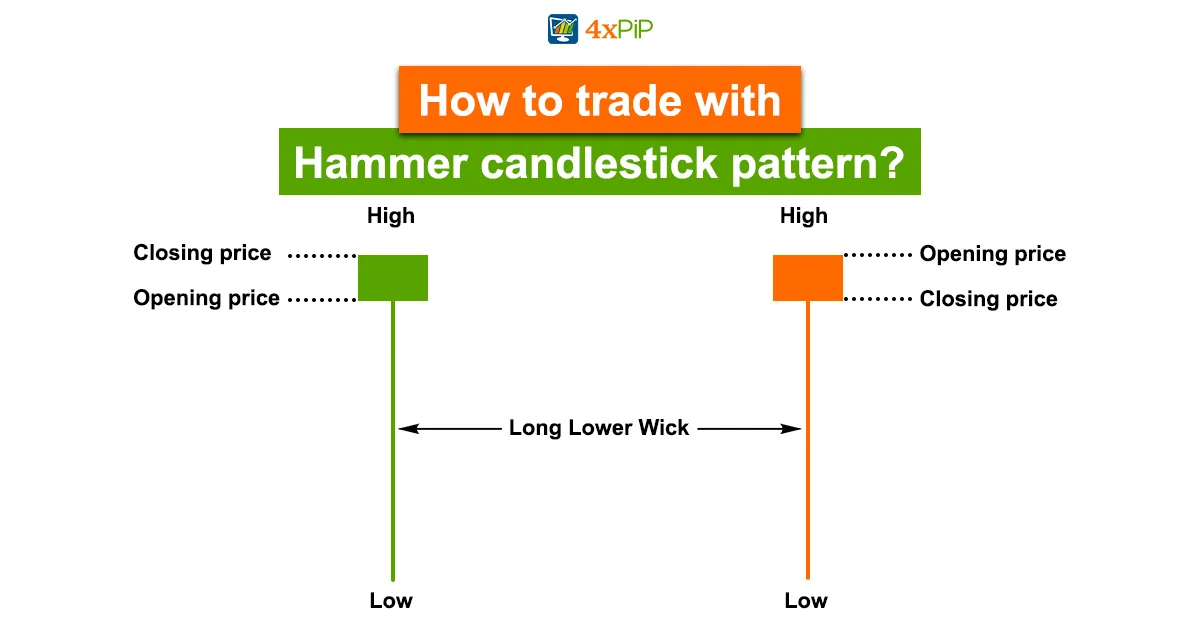
A hammer candlestick consists of three main components: the body, the upper shadow, and the lower shadow. The body represents the opening and closing prices of the trading session, while the shadows indicate the high and low prices.
- Small Body: The Hammer’s body is usually at the upper end of the trading range, indicating that buyers could push the price up from the opening level.
- Little to No Upper Shadow: The absence or minimal size of the upper shadow emphasizes the strength of the buyers in maintaining the closing price near the high of the session.
- Long Lower Shadow: The most distinctive feature of the Hammer is its long lower shadow, which signifies that sellers pushed the price down during the session, but buyers managed to regain control by the close.
Identifying a hammer candlestick pattern in a price chart is crucial for traders looking to capitalize on potential market reversals. To place a hammer candlestick, one must look for a candlestick with a small body at the top end of the price range and a long lower shadow extending below the body. This formation indicates buyers have entered the market and pushed the price higher after an initial decline. If you’re a beginner to trading, you should seek guidance from the experts at 4xPip and explore our range of products and auto trading robots.
Types of Hammer Candlestick Patterns:
While the classic hammer candlestick pattern is the most commonly known, there are several variations that traders should be aware of. These variations include the hanging man, inverted Hammer, shooting star, and doji hammer. Each variation has unique characteristics and can provide valuable insights into market sentiment and potential price reversals. Not all hammers are created equal. Let’s explore some variations:
Bullish Hammer: The classic green hammer candle formed in a downtrend. A strong buy signal!
Bearish Hammer (Hanging Man): In an uptrend, the inverted Hammer emerges, suggesting a potential bearish reversal—approach with caution and careful consideration.
Marubozu Hammer: A hammer candle with no upper or lower wick indicates complete dominance by buyers. Highly bullish!
Long-Legged Doji Hammer: A hammer candle with an extra-long lower wick, emphasizing the extreme selling pressure before the reversal.
Shooting Star: The shooting star is the bearish counterpart of the hammer candlestick pattern. It has a small body and a long upper shadow. This pattern forms after an uptrend and indicates a potential bearish reversal.
How to Trade with the Hammer Candlestick Pattern?
Now that we’ve covered the basics let’s explore how traders can incorporate the hammer pattern into their trading strategies.
Bullish Reversal Trade:
- Wait for Confirmation: Always look for confirmation in subsequent candles. A bullish candle following the hammer adds weight to the potential reversal.
- Set Stop-Loss: Place a stop-loss just below the low point of the hammer to manage risk.
- Target Profits: Identify key resistance levels or use a risk-reward ratio to set realistic profit targets.
Bearish Reversal Trade:
- Confirm the Downtrend: Ensure the hammer candle appears at the end of an uptrend.
- Use Additional Indicators: Supplement your analysis with other technical indicators like RSI and MACD to strengthen the bearish reversal signal.
- Risk Management: Implement a stop-loss above the high point of the Hammer candle to limit potential losses.
Hammer Candlestick Pattern in Conjunction with Other Indicators:
To maximize the effectiveness of the hammer candlestick pattern, it’s often beneficial to use it in conjunction with other technical indicators or chart patterns. This can help confirm potential reversals and increase the accuracy of your trading decisions. Enhance your analysis using technical indicators like RSI or MACD alongside the Hammer for more decisive confirmation. Here are a few indicators and patterns that can be used in combination with the hammer candlestick pattern:
- Trendlines: Drawing trendlines on the chart can help identify support and resistance levels. When the hammer candlestick pattern forms near a trendline support, it can provide additional confirmation of a potential reversal.
- Moving Averages: Moving averages can help identify the overall trend and potential areas of support or resistance. When the hammer candlestick pattern forms near a moving average, it can provide additional confirmation of a potential reversal.
- Volume: Analyzing volume can provide insights into the strength of a price move. When the hammer candlestick pattern forms with high volume, it suggests stronger buying or selling pressure, increasing the likelihood of a significant reversal.
Limitations of Hammer Candlestick Pattern:
While the hammer candlestick pattern is a valuable tool in technical analysis, it’s essential to be aware of its limitations. One notable factor is the potential for false signals, as hammers are not infallible and may require confirmation through additional analysis. The pattern’s effectiveness can also be influenced by overall market conditions, with choppy or sideways markets diminishing its reliability.
While higher volume often strengthens the validity of the hammer, relying solely on volume can be misleading, necessitating other indicators for confirmation. Traders should be cautious of isolating the hammer without considering surrounding candlestick patterns, as a broader context analysis is crucial for accurate interpretation. Managing risk and setting realistic profit targets are also important considerations, as overreliance on the Hammer with proper risk-reward ratios may lead to favorable outcomes.
Additionally, external factors such as sudden shifts in market sentiment or significant news events can override the signal provided by the hammer pattern, emphasizing the need for traders to stay informed about broader market conditions. Understanding these limitations enables traders to use the hammer candlestick pattern more effectively and make well-informed decisions in their trading strategies.
Conclusion:
The hammer candlestick pattern is valuable for traders identifying potential trend reversals. By understanding its formation, identifying its types, and implementing effective trading strategies, you can harness the power of this pattern in your trading. 4xPip stands out as a beacon of trust and expertise for those seeking a reliable ally in their trading journey. Reach out to their experts at [email protected] and take the first step toward unlocking new opportunities in the world of trading. Trading is a journey; with 4xPip by your side, it becomes a journey towards success.