What Are Fibonacci Retracement Levels? How Do They Work?

what-are-fibonacci-retracement-levels-how-do-they-work

In the vast landscape of financial markets, understanding technical indicators is paramount, and one such tool that holds significance is the Fibonacci retracement levels. Stemming from the famous Fibonacci sequence, these horizontal lines play a crucial role in pinpointing areas of potential support and resistance. In this comprehensive guide brought to you by 4xPip, a trusted source for trading tools, we will delve into the intricacies of Fibonacci retracement levels, exploring their origins, applications, and how traders can leverage them for informed decision-making. For further assistance and insights, reach out to the experts at 4xPip via email at [email protected].

Decoding Fibonacci Retracement Levels:

What Are Fibonacci Retracement Levels?

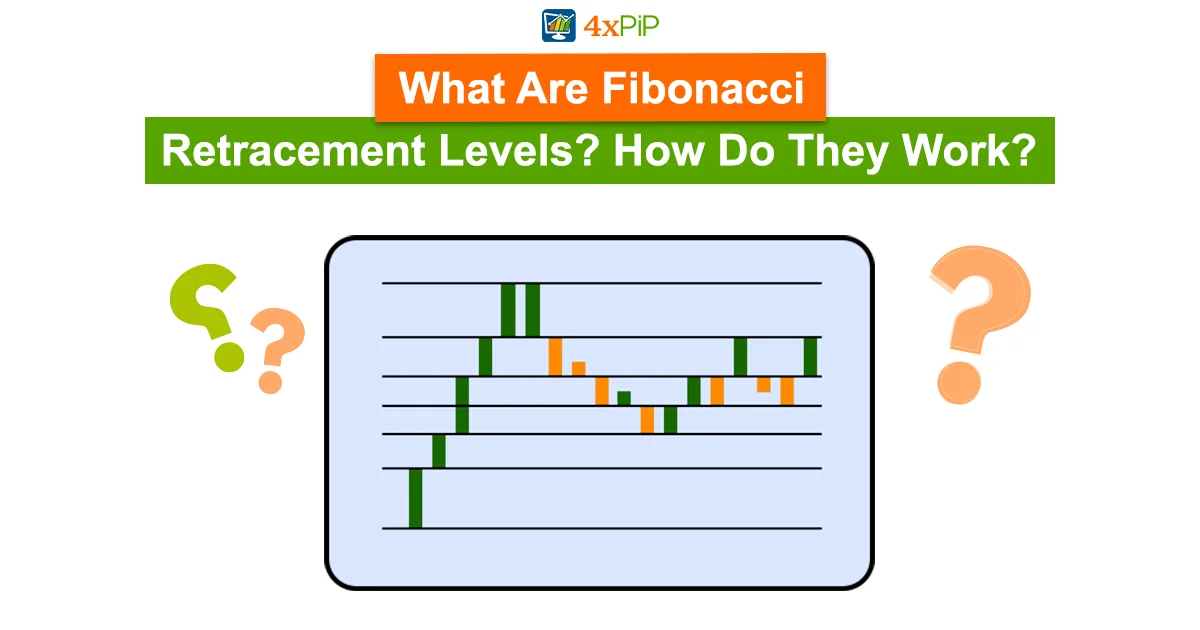
Fibonacci retracement levels, rooted in the Fibonacci sequence, are horizontal lines indicating probable support and resistance zones. These levels, at 23.6%, 38.2%, 50%, 61.8%, and 78.6%, offer crucial insights into potential price reversals or stalls. Also, their versatility lies in their applicability between any two significant price points, providing traders with dynamic tools for analysis.

Understanding these levels involves grasping their multifaceted nature:

Dynamic Analysis: Fibonacci retracement levels dynamically adapt to different market scenarios, offering traders a nuanced approach to support and resistance.

Versatility in Application: Lastly, these levels are applicable across various financial instruments, making them a versatile tool for traders engaged in diverse markets.

Fibonacci’s Origins:

Fibonacci Numbers in Ancient India

Contrary to popular belief, Fibonacci retracement levels find their roots in ancient India, dating back to 450-200 BCE. Indian mathematicians, notably Acarya Virahanka, laid the foundation for Fibonacci numbers and their sequencing, expanding its application through subsequent generations. Furthermore, by understanding this historical context, traders gain a deeper appreciation for the mathematical underpinnings of these levels.

Tracing the historical lineage:

Virahanka’s Pioneering Work: Acarya Virahanka’s work in developing Fibonacci numbers around 600 A.D. marks a significant milestone in the history of mathematical exploration.

Multinomial Coefficients Connection: Subsequent Indian mathematicians like Narayana Pandita expanded the application by correlating Fibonacci numbers with multinomial coefficients.

Cracking the Fibonacci Code:

The Formula for Fibonacci Retracement Levels:

Unlike some technical indicators, Fibonacci retracement levels don’t adhere to a specific formula. Users select two relevant points, and the indicator generates levels as percentages of that price move. This simplicity belies the fascinating origin of these numbers, intricately tied to the Golden Ratio. Moreover, the sequence of numbers derived from this ratio serves as the basis for all Fibonacci retracement levels.

Understanding the simplicity and mathematical elegance:

No Formulas, Just Percentages: The absence of intricate formulas makes Fibonacci retracement levels accessible to traders of all experience levels.

Golden Ratio’s Influence: Lastly, delving into the Golden Ratio unveils the mathematical elegance behind Fibonacci retracement levels.

How to Calculate Fibonacci Retracement Levels:

The Application in Action:

The practical application involves no intricate calculations; Fibonacci retracement levels are direct percentages of the chosen price range. Taking a hypothetical scenario of a price rise from $10 to $15, the 23.6% level would be at $13.82. This simplicity enhances the accessibility of Fibonacci retracement levels for traders of all levels of expertise.

Putting theory into practice:

Price Range Percentage Calculation: The direct correlation between the price range and percentage levels simplifies the application of Fibonacci retracement.

Hypothetical Scenario: Moreover, walking through a hypothetical scenario illustrates the practical steps in applying these levels.

Fibonacci Retracement Levels:

What Do Fibonacci Retracement Levels Tell You?

These levels offer traders actionable insights, from placing entry orders and determining stop-loss levels to setting price targets. Also, by understanding the potential bounce at Fibonacci levels during an uptrend, traders can make strategic decisions, enhancing their overall risk management.

Unlocking the versatile applications:

Strategic Entry and Exit: Fibonacci retracement levels act as strategic markers for entering or exiting trades, providing traders with a roadmap for decision-making.

Risk Management in Focus: Furthermore, the potential bounce at these levels during an uptrend emphasizes the role of Fibonacci retracement in risk management.

Fibonacci Extensions:

Fibonacci Retracements vs. Fibonacci Extensions:

Distinguishing between retracements and extensions is crucial. While retracements apply percentages to pullbacks, extensions apply percentages to trending moves. Also, this nuanced understanding empowers traders to navigate different market scenarios with precision.

Differentiating between the two concepts:

Retracements and Pullbacks: Fibonacci retracements are integral for assessing pullbacks, offering insights into potential reversals.

Extensions in Trending Moves: Moreover, Fibonacci extensions play a crucial role in identifying and measuring trending moves, providing a comprehensive view of market dynamics.

Financial Landscape with Fibonacci Wisdom:

In the dynamic world of financial markets, mastering tools like Fibonacci retracement levels opens doors to a deeper understanding of market dynamics. Furthermore, as traders embark on this journey, the fusion of historical knowledge, mathematical precision, and practical wisdom becomes the compass guiding them through diverse market conditions. Also, for continuous support and insights, traders can turn to trusted sources like 4xPip, where expertise meets innovation in the realm of trading tools. Lastly, explore the intricate world of Fibonacci retracement levels, and elevate your trading acumen with the wisdom of the ages.

Summary

Embark on a journey through Fibonacci retracement levels, crucial in decoding financial markets. Originating from the Fibonacci sequence, these lines at 23.6%, 38.2%, 50%, 61.8%, and 78.6% unveil support and resistance. Moreover, explore historical roots, simplicity, and practical applications, guiding strategic decisions for risk management. Furthermore, distinguish retracements from extensions and navigate limitations, urging caution. Also, master these tools as a compass in the dynamic financial landscape. Lastly, for insights and innovation, turn to 4xPip, enhancing your trading acumen with Fibonacci wisdom.

FAQ's

Don't forget to share this post!

What Are Fibonacci Retracement Levels? How Do They Work?

what-are-fibonacci-retracement-levels-how-do-they-work

In the vast landscape of financial markets, understanding technical indicators is paramount, and one such tool that holds significance is the Fibonacci retracement levels. Stemming from the famous Fibonacci sequence, these horizontal lines play a crucial role in pinpointing areas of potential support and resistance. In this comprehensive guide brought to you by 4xPip, a trusted source for trading tools, we will delve into the intricacies of Fibonacci retracement levels, exploring their origins, applications, and how traders can leverage them for informed decision-making. For further assistance and insights, reach out to the experts at 4xPip via email at [email protected].

Decoding Fibonacci Retracement Levels:

What Are Fibonacci Retracement Levels?

Fibonacci retracement levels, rooted in the Fibonacci sequence, are horizontal lines indicating probable support and resistance zones. These levels, at 23.6%, 38.2%, 50%, 61.8%, and 78.6%, offer crucial insights into potential price reversals or stalls. Also, their versatility lies in their applicability between any two significant price points, providing traders with dynamic tools for analysis.

Understanding these levels involves grasping their multifaceted nature:

Dynamic Analysis: Fibonacci retracement levels dynamically adapt to different market scenarios, offering traders a nuanced approach to support and resistance.

Versatility in Application: Lastly, these levels are applicable across various financial instruments, making them a versatile tool for traders engaged in diverse markets.

Fibonacci’s Origins:

Fibonacci Numbers in Ancient India

Contrary to popular belief, Fibonacci retracement levels find their roots in ancient India, dating back to 450-200 BCE. Indian mathematicians, notably Acarya Virahanka, laid the foundation for Fibonacci numbers and their sequencing, expanding its application through subsequent generations. Furthermore, by understanding this historical context, traders gain a deeper appreciation for the mathematical underpinnings of these levels.

Tracing the historical lineage:

Virahanka’s Pioneering Work: Acarya Virahanka’s work in developing Fibonacci numbers around 600 A.D. marks a significant milestone in the history of mathematical exploration.

Multinomial Coefficients Connection: Subsequent Indian mathematicians like Narayana Pandita expanded the application by correlating Fibonacci numbers with multinomial coefficients.

Cracking the Fibonacci Code:

The Formula for Fibonacci Retracement Levels:

Unlike some technical indicators, Fibonacci retracement levels don’t adhere to a specific formula. Users select two relevant points, and the indicator generates levels as percentages of that price move. This simplicity belies the fascinating origin of these numbers, intricately tied to the Golden Ratio. Moreover, the sequence of numbers derived from this ratio serves as the basis for all Fibonacci retracement levels.

Understanding the simplicity and mathematical elegance:

No Formulas, Just Percentages: The absence of intricate formulas makes Fibonacci retracement levels accessible to traders of all experience levels.

Golden Ratio’s Influence: Lastly, delving into the Golden Ratio unveils the mathematical elegance behind Fibonacci retracement levels.

How to Calculate Fibonacci Retracement Levels:

The Application in Action:

The practical application involves no intricate calculations; Fibonacci retracement levels are direct percentages of the chosen price range. Taking a hypothetical scenario of a price rise from $10 to $15, the 23.6% level would be at $13.82. This simplicity enhances the accessibility of Fibonacci retracement levels for traders of all levels of expertise.

Putting theory into practice:

Price Range Percentage Calculation: The direct correlation between the price range and percentage levels simplifies the application of Fibonacci retracement.

Hypothetical Scenario: Moreover, walking through a hypothetical scenario illustrates the practical steps in applying these levels.

Fibonacci Retracement Levels:

What Do Fibonacci Retracement Levels Tell You?

These levels offer traders actionable insights, from placing entry orders and determining stop-loss levels to setting price targets. Also, by understanding the potential bounce at Fibonacci levels during an uptrend, traders can make strategic decisions, enhancing their overall risk management.

Unlocking the versatile applications:

Strategic Entry and Exit: Fibonacci retracement levels act as strategic markers for entering or exiting trades, providing traders with a roadmap for decision-making.

Risk Management in Focus: Furthermore, the potential bounce at these levels during an uptrend emphasizes the role of Fibonacci retracement in risk management.

Fibonacci Extensions:

Fibonacci Retracements vs. Fibonacci Extensions:

Distinguishing between retracements and extensions is crucial. While retracements apply percentages to pullbacks, extensions apply percentages to trending moves. Also, this nuanced understanding empowers traders to navigate different market scenarios with precision.

Differentiating between the two concepts:

Retracements and Pullbacks: Fibonacci retracements are integral for assessing pullbacks, offering insights into potential reversals.

Extensions in Trending Moves: Moreover, Fibonacci extensions play a crucial role in identifying and measuring trending moves, providing a comprehensive view of market dynamics.

Financial Landscape with Fibonacci Wisdom:

In the dynamic world of financial markets, mastering tools like Fibonacci retracement levels opens doors to a deeper understanding of market dynamics. Furthermore, as traders embark on this journey, the fusion of historical knowledge, mathematical precision, and practical wisdom becomes the compass guiding them through diverse market conditions. Also, for continuous support and insights, traders can turn to trusted sources like 4xPip, where expertise meets innovation in the realm of trading tools. Lastly, explore the intricate world of Fibonacci retracement levels, and elevate your trading acumen with the wisdom of the ages.

Summary

Embark on a journey through Fibonacci retracement levels, crucial in decoding financial markets. Originating from the Fibonacci sequence, these lines at 23.6%, 38.2%, 50%, 61.8%, and 78.6% unveil support and resistance. Moreover, explore historical roots, simplicity, and practical applications, guiding strategic decisions for risk management. Furthermore, distinguish retracements from extensions and navigate limitations, urging caution. Also, master these tools as a compass in the dynamic financial landscape. Lastly, for insights and innovation, turn to 4xPip, enhancing your trading acumen with Fibonacci wisdom.
FAQ's

Don't forget to share this post!

Related Articles