Welcome to our exploration of the Value Added Monthly Index, or VAMI, a valuable tool in the world of trading. At 4xPip, your go-to source for trading tools and expertise, we are thrilled to offer you insights into this essential metric that can enhance your trading journey. In this blog, we will delve into the concept of Value Added Monthly Index, provide explanations, discuss applications for comparisons, explore the available tools, and cover an additional topic for a well-rounded understanding. Feel free to reach out to our experts at [email protected] for further guidance.
What Is VAMI?
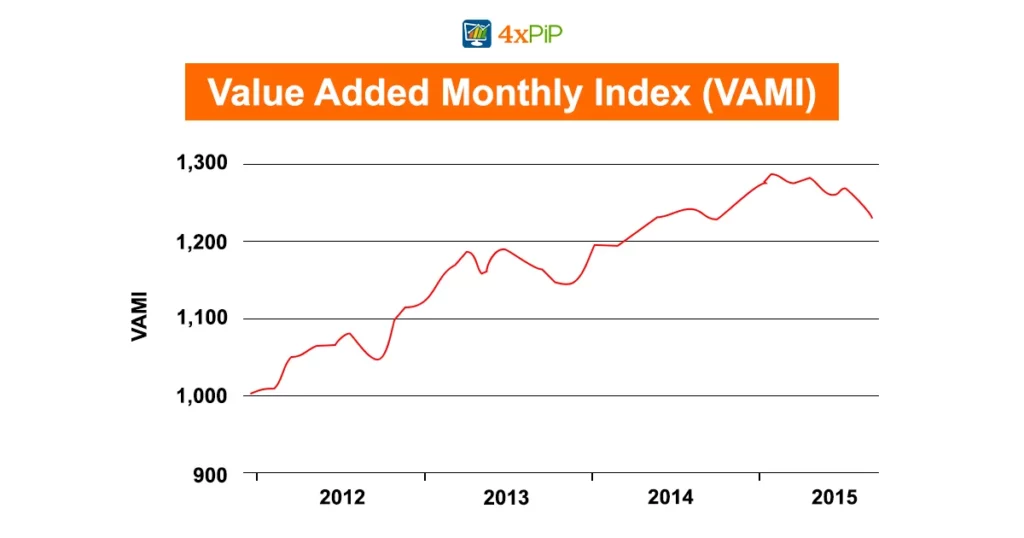
The Value Added Monthly Index, or VAMI, serves as a metric for tracking and assessing the performance of a trading or investment strategy over time. Traders and investors can use it as an excellent tool to monitor the growth or decline of a portfolio, gaining insights into its profitability. Represented typically as a time series, VAMI allows users to visualize the historical performance of their investments. By initiating with an initial value and tracking changes over time, VAMI offers a clear picture of the trading strategy’s performance.
VAMI is particularly useful for analyzing trading systems and investment strategies, allowing users to measure and compare performance objectively. When using VAMI, traders can see not just the final profit or loss but also how the journey to that point unfolded. This metric can help traders identify strengths and weaknesses in their strategies and make informed decisions to optimize their approach.
Value Added Monthly Index Explained:
Now, let’s dive deeper into the explanation of the Value Added Monthly Index. As mentioned earlier, the Value Added Monthly Index is a time series that tracks the value of a portfolio over time, reflecting changes due to both trading performance and capital addition or withdrawal. Here’s a more detailed breakdown of how it works:
Initial Value: VAMI starts with an initial value, which represents the starting point of a trading or investment strategy. This value is often set at 100 or 1,000 for easy tracking.
Monthly Updates: The key feature of VAMI is its monthly updates. At the end of each month, we adjust the value of the portfolio based on the trading performance during that month. This adjustment takes into account both the trading gains (profits) and losses.
Capital Changes: VAMI also factors in capital changes. If an investor deposits additional funds into the portfolio, the VAMI value increases. Conversely, if capital is withdrawn, the value decreases.
Cumulative Representation: The VAMI value is cumulative, meaning it reflects the overall performance and growth (or decline) of the portfolio over time. It captures the entire journey, not just the endpoint.
Understanding how VAMI works is crucial for traders and investors as it provides an accurate reflection of strategy performance. It enables better decision-making by helping traders identify the strengths and weaknesses of their trading systems.
Risk Management and VAMI:
An additional and vital aspect to consider alongside Value Added Monthly Index (VAMI) is risk management. When assessing trading strategies using VAMI, effective risk management becomes critical for traders and investors. Risk management aims to keep the risks associated with a particular trading or investment strategy within acceptable boundaries.
Here are some key components of risk management when working with VAMI:
Setting Stop-Loss Orders: One common risk management practice is to establish stop-loss orders. These orders allow traders to define a predetermined level at which they are willing to exit a trade to limit potential losses. By incorporating stop-loss orders into their trading strategy, traders can minimize the impact of adverse price movements.
Diversifying Investments: Diversification is another fundamental risk management technique. Instead of putting all their capital into a single asset or market, traders spread their investments across different assets or markets. This diversification strategy aims to reduce the impact of poor performance in one area by capitalizing on the success of others.
Risk Tolerance Assessment: Traders must have a clear understanding of their risk tolerance. Risk tolerance is a personal assessment of how much risk one is comfortable taking. It depends on individual financial goals, time horizons, and emotional resilience. When aligning risk tolerance with VAMI analysis, traders can ensure that their strategies are in harmony with their comfort levels.
Regular Review and Adjustments: Risk management is an ongoing process. Traders should periodically review and assess the effectiveness of their risk management strategies in combination with VAMI analysis. Adjustments and refinements should be made as needed.
By combining VAMI analysis with sound risk management practices, traders can make more informed decisions, protect their capital, and optimize their trading success. Understanding risk and incorporating risk management strategies into their trading approach is a crucial step for traders at all levels of experience.
If you have further questions or need guidance on risk management strategies, feel free to reach out to our experts at 4xPip. We’re here to provide you with the tools and knowledge you need to navigate the world of trading effectively.
How It’s Used for Comparison:
VAMI is a valuable tool for comparing the performance of different trading strategies or investment portfolios. Here’s how it’s used for comparison:
Objective Assessment: VAMI offers an objective way to assess the performance of different strategies. Instead of relying solely on profits or losses, traders can look at the VAMI curve to evaluate the consistency and stability of each strategy.
Risk Analysis: VAMI provides insights into the risk associated with a trading strategy. Steady growth in VAMI indicates a more stable and lower-risk strategy, while sharp fluctuations may suggest higher risk.
Apples-to-Apples Comparison: VAMI allows for apples-to-apples comparisons, as it accounts for both trading gains and capital changes. This makes it easier to determine which strategy is more effective.
Visual Representation: The graphical representation of Value Added Monthly Index over time makes it easy to compare multiple strategies at a glance. Traders can see which strategy has a smoother and more consistent performance history.
Adaptation: By comparing VAMI curves, traders can identify strategies that need adjustments or improvements, leading to a more informed approach to trading.
VAMI is a powerful tool for traders and investors, enabling them to compare and choose the most suitable strategies for their goals and risk tolerance.
Tools:
When it comes to working with VAMI, various tools are available to assist traders and investors in calculating and visualizing their Value Added Monthly Index. These tools are designed to simplify the process and provide valuable insights. Some key tools include:
Excel Spreadsheets: Many traders use Excel or other spreadsheet software to calculate and plot VAMI. This allows for customization and flexibility in analyzing portfolio performance.
Trading Platforms: Some trading platforms offer built-in tools for tracking VAMI, making it convenient for users to monitor their portfolio’s progress.
Trading Software: Certain trading software and algorithmic trading platforms have integrated VAMI tracking and analysis features. These can automate the process and provide real-time updates.
Online Calculators: Various online tools and calculators are available for traders who prefer a hassle-free way of calculating VAMI. These calculators require inputting essential data, and they generate VAMI graphs and statistics.
Data Providers: Professional traders and institutions may subscribe to data providers that offer advanced analytics, including VAMI tracking, to gain a deeper understanding of their performance.
Choosing the right tool depends on individual preferences and the complexity of the trading strategy. Some traders may prefer the simplicity of Excel, while others may opt for automated solutions provided by trading platforms or software.
Summary:
In summary, the Value Added Monthly Index (VAMI) is an invaluable tool for traders and investors. It tracks the performance of trading or investment portfolios over time, providing an objective means to assess strategy performance. VAMI takes into account both trading gains and capital changes, offering a comprehensive view of the journey and not just the final destination. It’s used for comparing and selecting trading strategies and can be assessed through various tools. When combined with effective risk management, VAMI empowers traders to make informed decisions and optimize their trading success.