The Ulcer Index (UI) is a lesser-known, but highly valuable, indicator in the world of trading. This powerful tool provides essential insights into risk and market volatility, which are critical for traders in various financial markets, from stocks to cryptocurrencies. In this article, we’ll delve into the Ulcer Index, explaining what it means, how it works, and how you can use it to enhance your trading strategies. Let’s unlock the potential of the Ulcer Index together.
For expert guidance and to explore trading tools and indicators, including those related to the Ulcer Index, contact 4xPip at [email protected].
What Does UI Mean?
The Ulcer Index, often abbreviated as UI, is a technical indicator that focuses on risk management. Unlike many other indicators, it doesn’t predict market direction or offer buy/sell signals. Instead, it quantifies the depth and duration of drawdowns, which are the declines in the value of an investment from its peak. In simpler terms, it tells you how much pain, or “ulcer,” you might feel when your investments are not performing well. Here’s a bit more insight:
The UI Indicator measures the magnitude and duration of drawdowns in your investment portfolio. It calculates how far an investment’s value falls below a previous peak, indicating the potential discomfort or “ulcer” you might experience during these downturns.
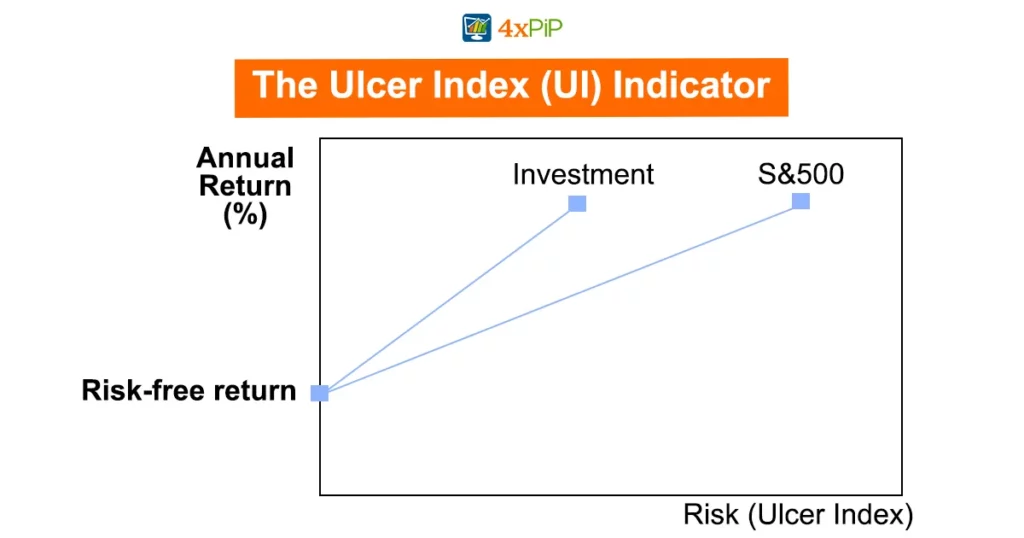
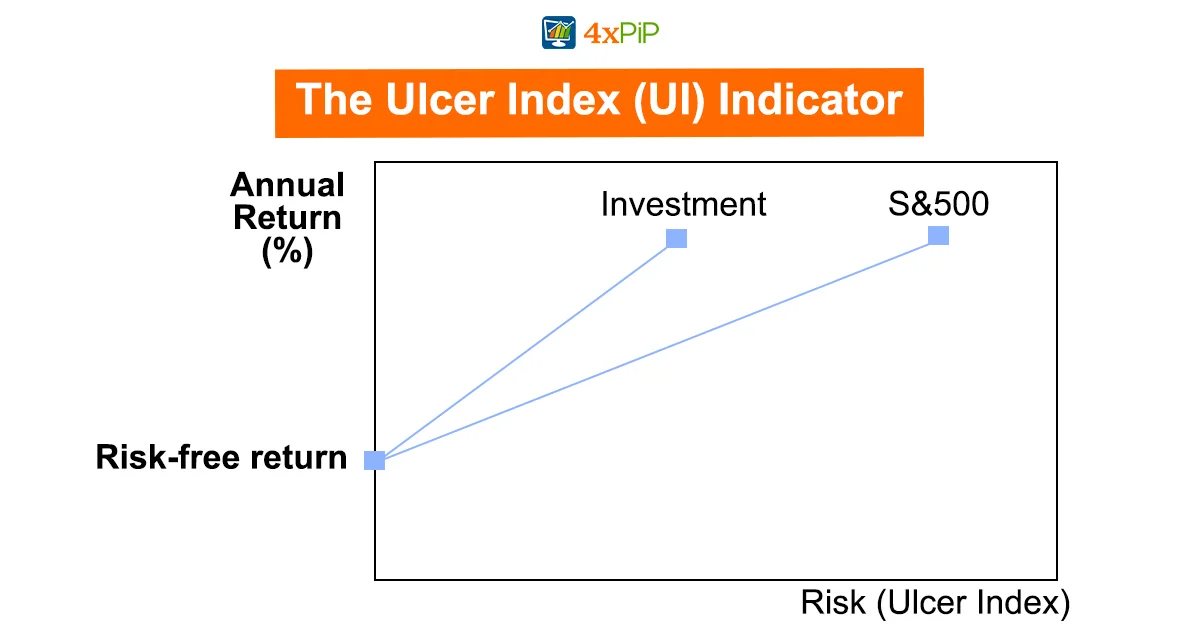
The key idea behind the Ulcer Index is to help traders and investors understand the downside risk of their investments. By quantifying the “pain” or discomfort of drawdowns, it provides a more nuanced perspective on risk, going beyond standard volatility measurements.
The lower the UI value, the less painful or deep the drawdowns are, suggesting a more stable and less risky investment. Conversely, a higher UI value indicates larger and longer drawdowns, suggesting higher risk.
This means the Ulcer Index is a valuable tool for risk-averse investors, as it helps them assess the potential emotional and financial toll of their investments during turbulent market periods. By knowing the UI of an investment, you can make more informed decisions and build a more resilient portfolio.
Explaining Ulcer Index:
To truly harness the power of the Ulcer Index, it’s important to understand how it works and why it’s so valuable in trading. Let’s dive into a more comprehensive explanation of this indicator:
The Ulcer Index was developed by Peter Martin in the early 1980s, with a focus on risk management in the financial markets. Unlike traditional volatility measures, which focus on the speed and size of price changes, the UI Indicator zeroes in on the downside risk and emotional impact of drawdowns.
It calculates the UI by taking the square root of the average of squared percentage drawdowns over a specified period. In essence, it’s quantifying the average depth and duration of drawdowns, expressed as a percentage.
By using a moving average, the UI smooths out the values, making it easier to interpret. This smoothing helps traders avoid knee-jerk reactions to short-term market fluctuations.
The Ulcer Index can be calculated for different time frames, allowing traders to tailor their risk assessment to their specific trading strategies. Short-term traders might use a 10-day UI, while long-term investors may opt for a 200-day UI.
The UI is valuable because it provides a deeper insight into risk. While high volatility indicators might suggest significant price swings, the UI tells you how those swings can affect your emotional and financial well-being. It helps traders make more balanced, risk-aware decisions and build portfolios that match their risk tolerance.
Calculating the Ulcer Index:
Now that you understand the concept and significance of the Ulcer Index, let’s take a closer look at how it’s calculated. The Ulcer Index calculation is a bit more complex than some other indicators, but it’s worth the effort for traders seeking a comprehensive risk assessment tool. Here’s a breakdown of how to calculate the Ulcer Index:
Gather Data: First, you’ll need historical data for the investment you want to analyze. This data should include daily closing prices, typically for a specified period, such as 200 days.
Calculate the Percentage Drawdowns: For each day, calculate the percentage drawdown from the highest previous peak. In other words, determine how much the investment’s value has fallen from its highest point. Square these values.
Average the Squared Drawdowns: Calculate the average of the squared drawdowns over the specified period (e.g., 200 days).
Take the Square Root: To obtain the Ulcer Index, take the square root of the average squared drawdowns. This step is essential because it provides a more intuitive, easily interpretable value.
Express as a Percentage: The final Ulcer Index value is usually expressed as a percentage.
It’s important to note that the Ulcer Index is typically calculated using a moving average of squared drawdowns, which smooths out the values for a more user-friendly interpretation. The choice of the period for the calculation can vary based on the trader’s preferences and investment strategy. Short-term traders might use a 10-day UI, while long-term investors might opt for a 200-day UI.
Calculating the Ulcer Index can be done manually, but many trading platforms and software tools offer automated Ulcer Index calculations, making it easier for traders to access this valuable risk assessment metric.
How To Use UI Indicators:
The Ulcer Index is a valuable tool for traders, but how do you use it effectively in your trading strategy? Here are some practical steps to make the most of this indicator:
Risk Assessment: Use the Ulcer Index to assess the downside risk of your investments. A lower UI value suggests a more stable and less risky investment, while a higher value indicates higher risk. Consider your risk tolerance when interpreting UI values.
Portfolio Diversification: If you have a portfolio of multiple assets, the UI can help you assess the overall risk. Diversify your investments to maintain a healthy balance between risk and return.
Setting Stop-Loss Orders: Based on the UI value, you can set appropriate stop-loss orders to limit potential losses during drawdowns. This risk management strategy can help protect your capital.
Selecting Investment Opportunities: When considering new investments, use the Ulcer Index to evaluate potential assets. Lower UI values may indicate investments with less emotional and financial discomfort during downturns.
Combine with Other Indicators: The Ulcer Index works best when used in conjunction with other technical indicators. For example, combining it with trend-following or momentum indicators can provide a well-rounded view of market conditions.
Periodic Review: Regularly review the Ulcer Index for your investments. Market conditions can change, so it’s important to keep an eye on the risk level in your portfolio.
By incorporating the Ulcer Index into your trading strategy, you can make more informed decisions, better manage risk, and build a portfolio that aligns with your financial goals and emotional comfort.
Benefits of Using the Ulcer Index:
The Ulcer Index offers a unique perspective on risk management in trading. Here are some key benefits of using the Ulcer Index:
Quantifies Emotional Impact: Unlike standard volatility measures, the Ulcer Index provides an emotional context for risk. It quantifies the emotional discomfort or “ulcer” you might experience during drawdowns.
More Comprehensive Risk Assessment: The UI focuses on the depth and duration of drawdowns, offering a deeper understanding of risk than many other indicators.
Tailored to Risk Tolerance: Traders can customize their risk assessment by choosing the time frame for the UI calculation, allowing them to match the indicator to their risk tolerance and trading style.
Risk Management Tool: The UI helps traders set appropriate stop-loss orders and make well-informed risk management decisions.
Objective Risk Assessment: By providing a numerical value, the Ulcer Index offers an objective assessment of risk, helping traders avoid emotional, impulsive decisions.
The Ulcer Index (UI) isn’t just another technical indicator in the world of trading; it’s a powerful tool that offers traders a unique perspective on risk management. As we explore the benefits of using the UI, you’ll discover how it quantifies not only financial risk but also the emotional impact of drawdowns in your investment portfolio. This comprehensive risk assessment tool provides a range of advantages, helping traders make informed decisions, manage risk, and navigate the complex landscape of financial markets with a more balanced approach. Here are some key benefits of incorporating the UI into your trading strategy:
Summary:
In summary, the Ulcer Index (UI) stands as a valuable risk assessment tool that quantifies the emotional and financial impact of drawdowns in investments. Offering a deeper perspective on risk compared to traditional volatility measures, a lower UI value indicates a more stable and less risky investment. By incorporating the Ulcer Index into trading strategies, traders can make more informed risk management decisions and build portfolios aligned with their risk tolerance, enhancing their ability to navigate the complexities of financial markets effectively.