In the ever-evolving landscape of financial markets, traders rely on various technical tools to decipher patterns that can influence their decisions. One such pattern that holds significance is the rectangle pattern. In this blog, we’ll delve into the intricacies of the rectangle pattern, exploring its characteristics, formation, and effective trading strategies. As your trusted source for trading tools, 4xPip is dedicated to providing valuable insights to enhance your trading journey. For expert guidance and a range of products, reach out to us at [email protected].
Understanding the Rectangle Pattern:
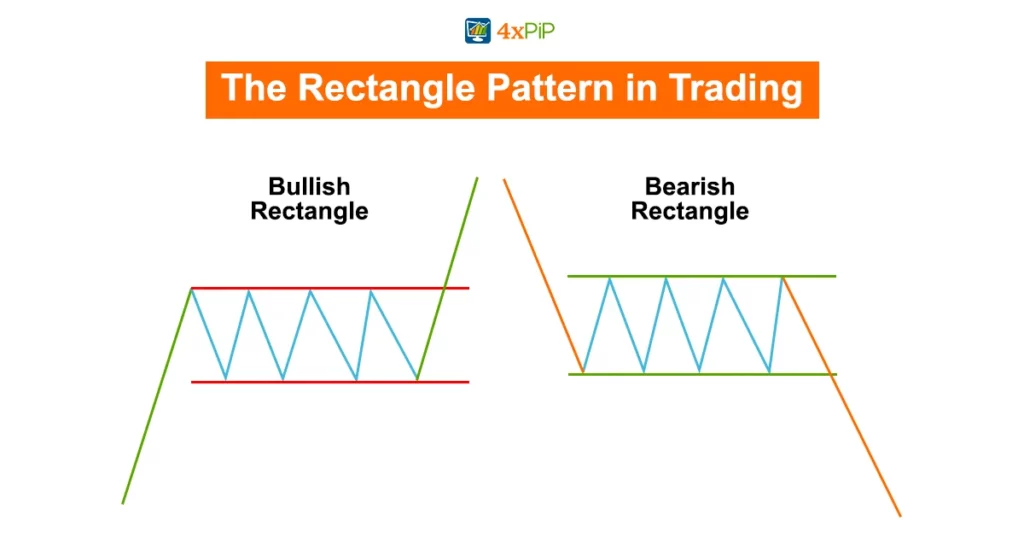
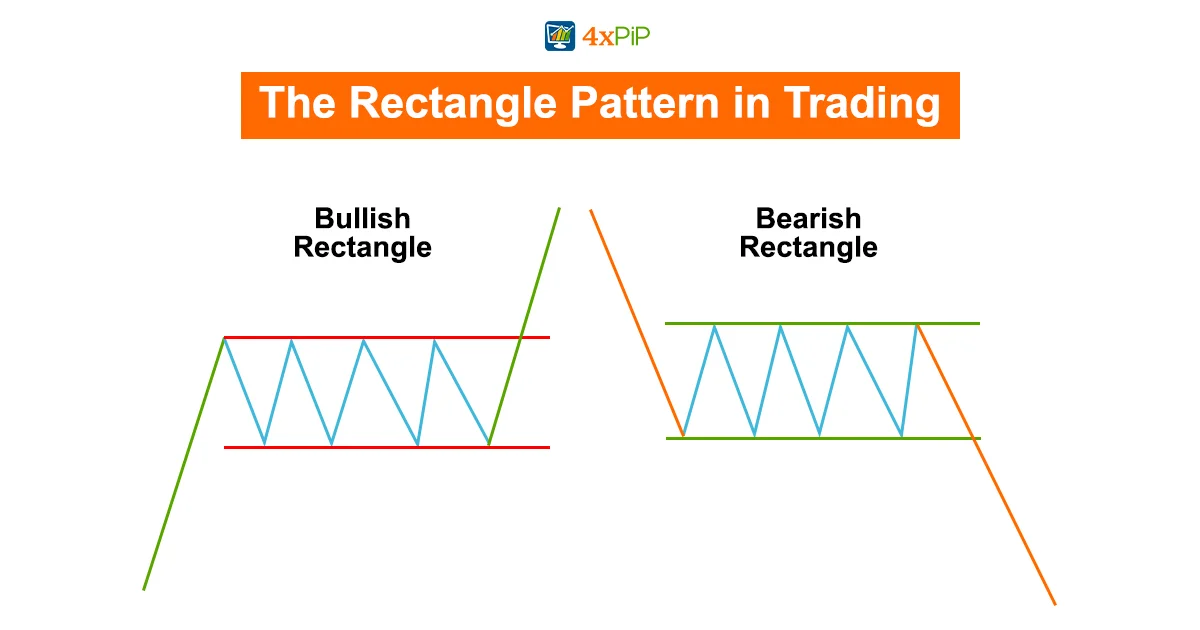
The rectangle pattern in trading is akin to a brief pause in the ongoing battle between buyers and sellers. Imagine it as a timeout where neither side is gaining significant ground. This pattern forms when the price of an asset moves within a channel defined by parallel support and resistance levels. Visually, it appears as a rectangle on the price chart, indicating a period of market consolidation. During this phase, the forces of supply and demand reach an equilibrium, resulting in a balanced struggle that prevents the price from making substantial moves in either direction.
The psychology behind the rectangle pattern is intriguing. Traders observe it as a representation of indecision in the market. Neither the bulls nor the bears are able to assert dominance, creating a scenario where the price bounces back and forth within a confined range. This phase can be both a challenge and an opportunity for traders. It challenges them to decipher the impending direction of the price, but it also presents an opportunity to anticipate potential breakouts or breakdowns once the pattern is resolved.
For traders delving into technical analysis, recognizing the rectangle pattern involves identifying specific characteristics. The parallel boundaries play a crucial role, in forming the framework for the pattern. Traders keen on spotting it look for multiple touches on both the upper and lower boundaries, reinforcing the pattern’s strength. The duration of the pattern’s consolidation phase is another key aspect. A more extended period of consolidation often hints at the potential for a more significant price movement once the market decides on its next direction. As traders delve into the intricacies of this pattern, they equip themselves with a tool that not only reflects market equilibrium but also signals the calm before a potential storm in the form of a breakout or breakdown.
Characteristics of the Rectangle Pattern:
Parallel Boundaries:
The rectangle pattern is defined by two parallel lines, representing the upper and lower boundaries. These lines are crucial as they outline the price range within which the market is consolidating. Traders identify these parallel boundaries to recognize the distinct rectangular shape on the chart.
Consolidation Phase:
This pattern indicates a period of market consolidation, suggesting a temporary pause in the prevailing trend. During this phase, the price moves within the confines of the parallel boundaries. Traders interpret this consolidation as a sign of indecision among market participants, as neither buyers nor sellers can assert dominance.
Equal Touches:
The strength of the rectangle pattern is reinforced by multiple touches on both the upper and lower boundaries. These touches signify a balanced struggle between buyers and sellers. The more times the price touches these boundaries without breaking out, the more robust the pattern becomes, highlighting the prolonged battle between market forces.
Continuation Pattern:
As a continuation pattern, the rectangle suggests that the existing trend is likely to resume once the consolidation phase concludes. Traders interpret the rectangle as a brief timeout in the ongoing trend, offering an opportunity to anticipate the potential direction of the next significant price movement.
Volume Analysis:
Traders pay close attention to trading volume when dealing with the rectangle pattern. An essential characteristic is the confirmation of a breakout or breakdown with increased volume. Higher volume during a breakout signals heightened market participation, adding validity to the pattern and indicating the potential for a sustained trend in the new direction.
Formation of the Rectangle Pattern:
The formation of the rectangle pattern is a fascinating phenomenon in the world of technical analysis, representing a dynamic struggle between buyers and sellers. Picture this: as the price of an asset moves within parallel support and resistance levels, a distinct rectangular shape emerges on the price chart. This shape signifies a temporary stalemate in the market, where neither buyers nor sellers manage to assert dominance. It’s akin to a tug of war, with both sides locked in a battle for control.
Understanding the formation of the rectangle pattern requires recognizing the delicate equilibrium it represents. During this phase, traders witness a state of indecision and balance, as reflected in the pattern’s rectangular structure. Buyers and sellers are essentially in a deadlock, creating an environment where the price moves sideways within the established boundaries. This consolidation period is crucial, as it sets the stage for potential future price movements. The rectangle pattern becomes a visual representation of this market indecision, providing traders with a clear signal that a breakout or breakdown may be on the horizon.
The duration of the rectangle’s formation is another essential aspect. Traders should pay attention to how long the consolidation phase persists, as a more prolonged period of indecision often leads to a more significant price movement once the pattern is resolved. Whether observed on intraday charts or longer-term daily and weekly charts, the rectangle pattern offers traders a unique insight into market psychology. As this pattern unfolds, patience becomes a virtue, and traders eagerly await confirmation signals, such as a decisive close above the upper boundary for a bullish breakout or below the lower boundary for a bearish breakout, before making strategic moves in the market.
Trading Strategies with the Rectangle Pattern:
- Breakout Trading:
Breakout trading is a popular strategy employed by traders when dealing with the rectangle pattern. The key concept here is to wait for a decisive close above the upper boundary for a bullish breakout or below the lower boundary for a bearish breakout. This strategy operates on the premise that a breakout signals the potential continuation of the prevailing trend. By joining the market at this pivotal moment, traders aim to capitalize on the emerging momentum.
Executing breakout trading with the rectangle pattern requires patience and a keen eye for confirmation signals. Traders often wait for a clear and convincing close beyond the boundaries to ensure the validity of the breakout. This approach allows them to align their positions with the developing trend, increasing the likelihood of favorable price movements.
- Range Trading:
Range trading is a strategy well-suited for sideways market conditions characterized by the rectangle pattern. Traders capitalize on price oscillations by buying near support and selling near resistance within an established range. The goal is to profit from price movements in the rectangle when the market lacks a clear trend.
Traders employing range trading with the rectangle pattern must closely monitor price levels near support and resistance. Timing is crucial in this strategy, as buying at the lower boundary and selling at the upper boundary allows traders to profit from the recurring price fluctuations within the rectangle’s confines.
- Volume Analysis:
Volume analysis is an integral aspect of trading the rectangle pattern, especially when confirming breakout signals. Traders pay close attention to trading volume during a breakout to assess the validity of the pattern. Increased volume during a breakout indicates heightened market participation, reinforcing the potential for a sustained trend in the direction of the breakout.
By incorporating volume analysis into their strategy, traders gain insights into the strength and conviction behind the price movement. High volume during a breakout adds a layer of confirmation, enhancing the reliability of the rectangle pattern. This strategic use of volume analysis contributes to a more comprehensive and informed trading approach.
Summary:
In summary, the rectangle pattern is a powerful tool for traders seeking to understand and capitalize on market consolidation phases. Recognizing its characteristics, understanding its formation, and implementing effective trading strategies can enhance a trader’s ability to make informed decisions. As with any trading approach, risk management remains paramount, and traders should use additional indicators and analysis methods to confirm signals and optimize their trading decisions.