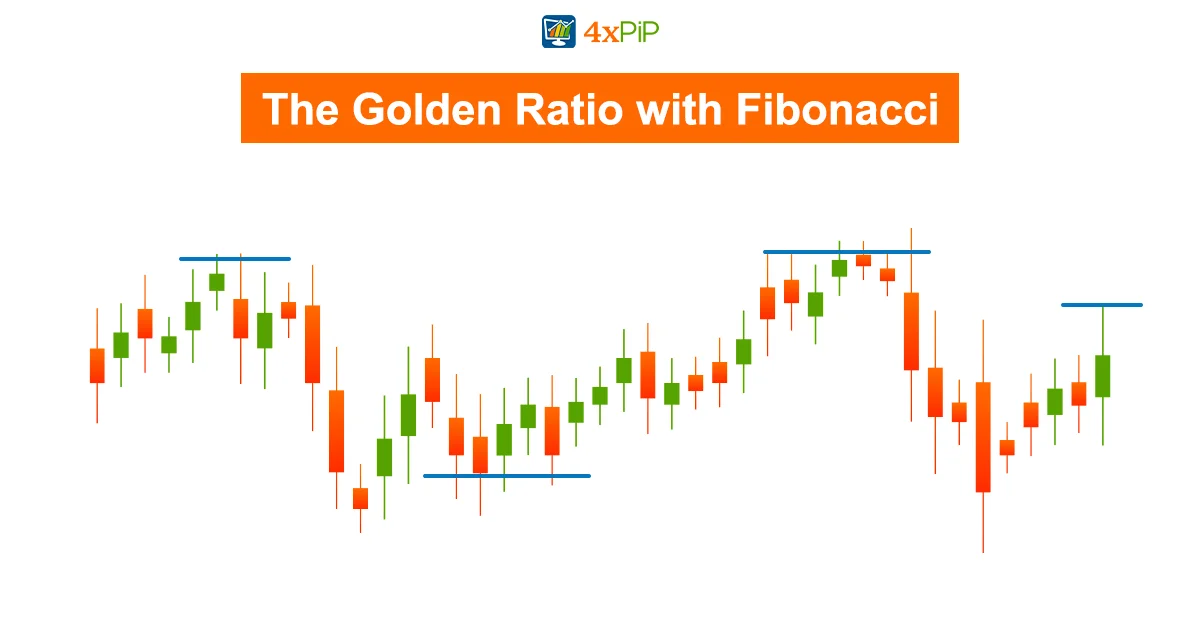
Embark on a captivating exploration into the Golden Ratio and Fibonacci synergy, where mathematical precision converges with the intricacies of nature, art, and financial markets. At 4xPip, a dedicated hub for trading tools, we unveil the secrets of these mathematical marvels. For expert insights and advanced tools, connect with us at [email protected].
The Mathematics Behind the Golden Ratio
Delving into the essence of the golden ratio involves unraveling the fascinating world of Fibonacci mathematics. At its core, the golden ratio is a unique number that arises from the Fibonacci sequence, a series of numbers in which each subsequent number is the sum of the two preceding ones. This sequence, discovered by the Indian mathematician Virahanka and later popularized by Leonardo Fibonacci, extends infinitely: 1, 1, 2, 3, 5, 8, 13, and so on. However, the true magic lies not merely in these numbers but in their tendency to approach a specific ratio as they progress – the golden ratio.
As the Fibonacci numbers advance, the ratio between each successive pair converges towards approximately 1.618. This seemingly unassuming number, often represented by the Greek letter phi (ϕ), is calculated as (1+√5)/2. What makes this ratio extraordinary is its prevalence in the natural world and the aesthetic harmony it imparts to various aspects of our surroundings. The mathematical dance between Fibonacci numbers and the golden ratio forms the bedrock of this intriguing phenomenon.
Beyond the numerical intricacies, the golden ratio can be grasped through a simple formula: ϕ = (1+√5) / 2. This formula encapsulates the essence of the ratio and is the key to understanding its recurring appearance in diverse fields, from the proportions of honeybee populations to the dimensions of architectural wonders like the Parthenon. The innate connection between the Fibonacci sequence and the golden ratio unveils a profound mathematical harmony that resonates across the realms of nature, art, and even financial markets.
Applications in Nature and Art
Witness the omnipresence of the golden ratio in the tapestry of the natural world. Nature’s patterns, like sunflower seeds and honeybee populations, follow the golden ratio for balance. Art, seen in the Parthenon and the Great Pyramid, embodies this aesthetic harmony. The timeless appeal of Da Vinci’s Mona Lisa reflects the golden ratio’s influence on visual beauty, transcending mathematical boundaries.
In Nature:
Sunflowers: The spirals of sunflower seed arrangements exhibit a 1.618 ratio between the diameters of each rotation, a testament to the golden ratio’s role in botanical design.
Honeybee Populations: The ratio of female bees to male bees in a hive often hovers around 1.618, showcasing the inherent balance encoded in the structure of bee communities.
Human Body: Various dimensions in the human body, from the arrangement of fingers to the proportions of facial features, subtly adhere to the golden ratio, highlighting its pervasive influence.
In Art:
The Parthenon: Iconic structures like the Parthenon in Athens draw on rectangles based on the golden ratio, creating a visually pleasing and harmonious architectural masterpiece.
Mona Lisa: Da Vinci’s Mona Lisa is not just a stroke of artistic genius but also a manifestation of mathematical elegance. Rectangles within the painting adhere to the golden ratio, contributing to the artwork’s timeless allure.
Great Pyramid in Giza: Architectural wonders, such as the Great Pyramid, incorporate the golden ratio in their proportions, adding a layer of aesthetic sophistication to these ancient structures.
The golden ratio, it seems, is not just a mathematical abstraction; it’s a guiding principle shaping the very fabric of existence, from the smallest components of nature to the grandeur of human creations.
Fibonacci in Financial Markets
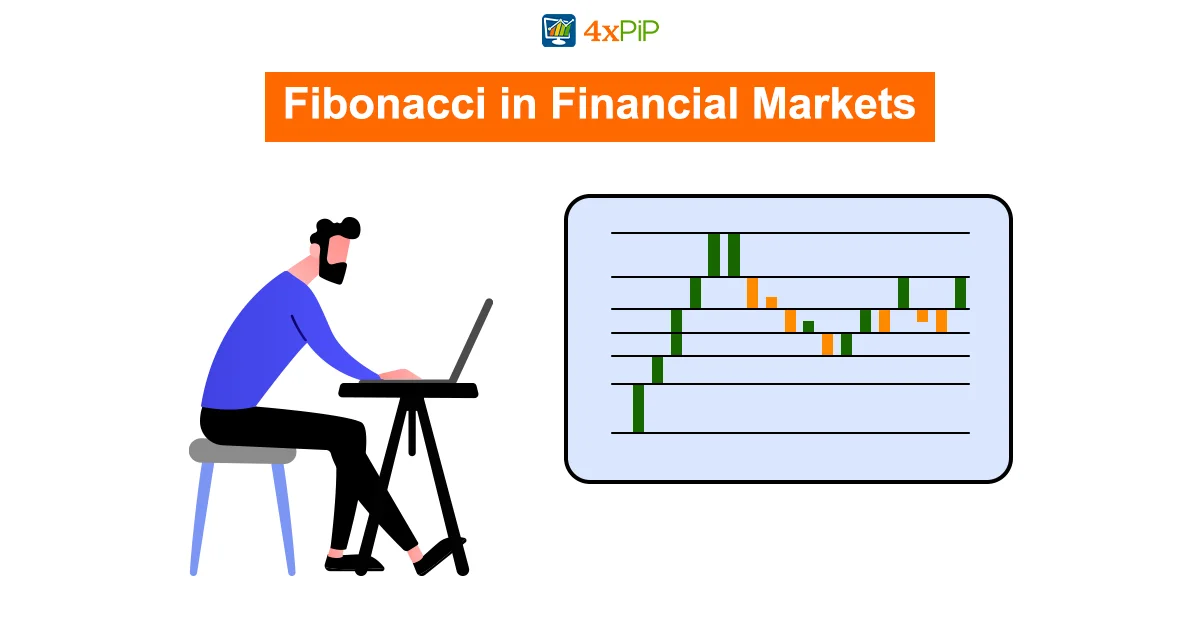
In financial markets, Fibonacci is a guiding force, weaving math precision into the unpredictable tapestry of trading. Traders use it to decode market behavior, turning patterns into profitable strategies. The Fibonacci sequence, a series where each number is the sum of its two predecessors, becomes a psychological touchstone for traders. As numbers converge towards the golden ratio of 1.618, they create strategic points for traders to take profits or cut losses. This psychological significance transforms Fibonacci into a tool for predicting market-driven price movements.
Real-world charts vividly illustrate the application of Fibonacci in financial analysis. The sequence, combined with key Fibonacci levels of 38.2%, 50%, and 61.8%, becomes a roadmap for traders. It assists in identifying trends, pinpointing potential reversal points, and establishing support and resistance levels. This strategic approach adds layers of sophistication to trading strategies, creating a self-fulfilling prophecy as more traders adopt Fibonacci-based methodologies. The interplay between the mathematical precision of Fibonacci and the behavioral nuances of traders forms a dynamic synergy that navigates the complexities of financial markets. From predicting trends to enhancing decision-making, Fibonacci becomes an invaluable ally in the trader’s toolkit.
Fibonacci Tools in Technical Analysis
In the realm of technical analysis, Fibonacci tools emerge as powerful instruments, providing traders with nuanced insights into potential market movements. Let’s delve into the intricacies of these tools, unraveling their applications and significance:
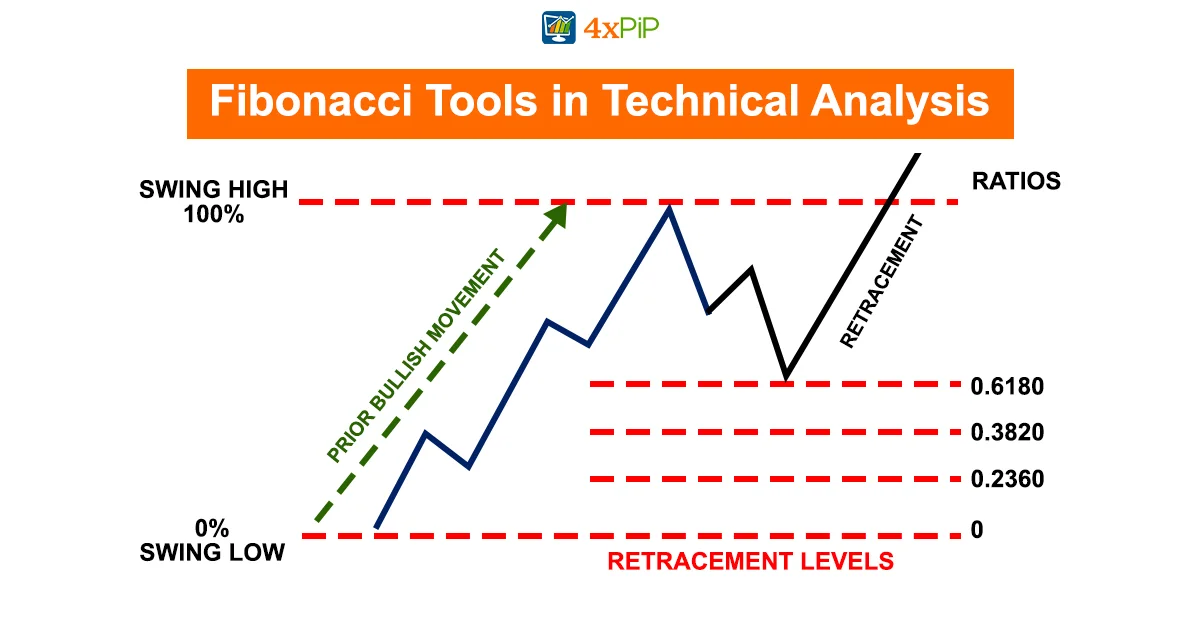
Fibonacci Retracements:
Purpose: Identify potential areas of support or resistance after significant price movements.
How it Works: Horizontal lines are drawn on a chart at key levels – 100%, 61.8%, 50%, 38.2%, and 0% – calculated using the high and low points.
Application: Traders use retracements to anticipate where prices might stall or reverse, aiding in strategic entry and exit points.
Fibonacci Arcs:
Purpose: Anticipate support, resistance, and trading ranges.
How it Works: Three curved lines are drawn at 38.2%, 50%, and 61.8% from a specific point, creating arcs.
Application: Traders use arcs to visualize potential price movements, providing a broader perspective on market dynamics.
Fibonacci Fans:
Purpose: Identify areas of support and resistance using diagonal lines.
How it Works: A specific point draws an invisible horizontal line, dividing it into 38.2%, 50%, and 61.8%. From the leftmost point, draw lines through each division.
Application: Fans assist in recognizing trendlines and potential reversal points, adding depth to technical analysis.
Fibonacci Time Zones:
Purpose: Explore time-based analysis for strategic timing of trades.
How it Works: Vertical lines are spaced according to the Fibonacci sequence (1, 1, 2, 3, 5, 8, 13, etc.).
Application: Each line represents a time period where significant price movement is expected, aiding traders in timing their entries and exits.
Combinations for Precision:
Purpose: Enhance accuracy by combining multiple Fibonacci tools.
How it Works: Traders often use a combination of retracements, arcs, fans, and time zones to obtain a more comprehensive forecast.
Application: This approach provides a nuanced understanding of potential market dynamics, minimizing risks and optimizing trading strategies.
Adapting to Market Conditions:
Purpose: Tailor Fibonacci tools to different market conditions.
How it Works: Depending on the market’s volatility, traders may adjust the Fibonacci percentages or timeframes for more relevant analysis.
Application: Adapting ensures that Fibonacci tools remain effective across various trading scenarios.
As traders navigate the complexities of financial markets, mastering Fibonacci tools becomes a valuable skill.
Debunking Myths and Realities
For golden ratio and Fibonacci, it’s crucial to dispel common misconceptions and unveil realities often getting clouded by myth. One prevalent myth is the mystical aura surrounding the golden ratio. While it holds immense significance in various fields, including mathematics, nature, art, and finance, it’s not a magical force. Its real power lies in its widespread application and not in some elusive, otherworldly quality. It’s a tool, a guiding principle, and a constant in the fabric of existence rather than a mysterious force.
Another misconception involves the universal applicability of the golden ratio. While its prevalence is undeniable, not every structure or natural phenomenon strictly adheres to this ratio. It’s not a one-size-fits-all template but a nuanced principle that manifests in diverse and sometimes unexpected ways. Similarly, in the realm of finance, there’s a myth that Fibonacci guarantees foolproof predictions. However, the reality is more nuanced. Fibonacci is a potent tool, but its effectiveness relies on a nuanced understanding of market dynamics and its integration with other analytical methods. It’s not a crystal ball but a valuable piece of the intricate puzzle that is financial analysis.
Summary
Embark on a fascinating journey into the synergy of Fibonacci and the Golden Ratio. Discover how these mathematical wonders influence nature, art, and financial markets. From the Fibonacci sequence giving rise to the Golden Ratio to its role in sunflowers, honeybees, and iconic artworks, witness the pervasive influence of this ratio. In financial markets, delve into how Fibonacci guides traders, offering strategic insights and predicting price movements. Explore Fibonacci tools in technical analysis, debunk common myths, and master these tools for a precise trading approach. For expert insights and advanced tools, reach out at [email protected].


