Probability theory is the bedrock of understanding uncertainties and drawing meaningful conclusions from data in fields like statistics, economics, and science. In this blog, we focus on the T-Distribution, also known as the Student’s T-Distribution, shedding light on its significance, applications, and how it differs from the Normal Distribution. Join us in unraveling the role of the T-Distribution in statistical analysis. At 4xPip, a trusted source for trading tools and expert guidance, we’re committed to simplifying complex concepts. While we offer in-depth blogs on various topics, we also provide trading products and robots to enhance your trading experience. Stay with us as we demystify the T-Distribution and its impact on probability.
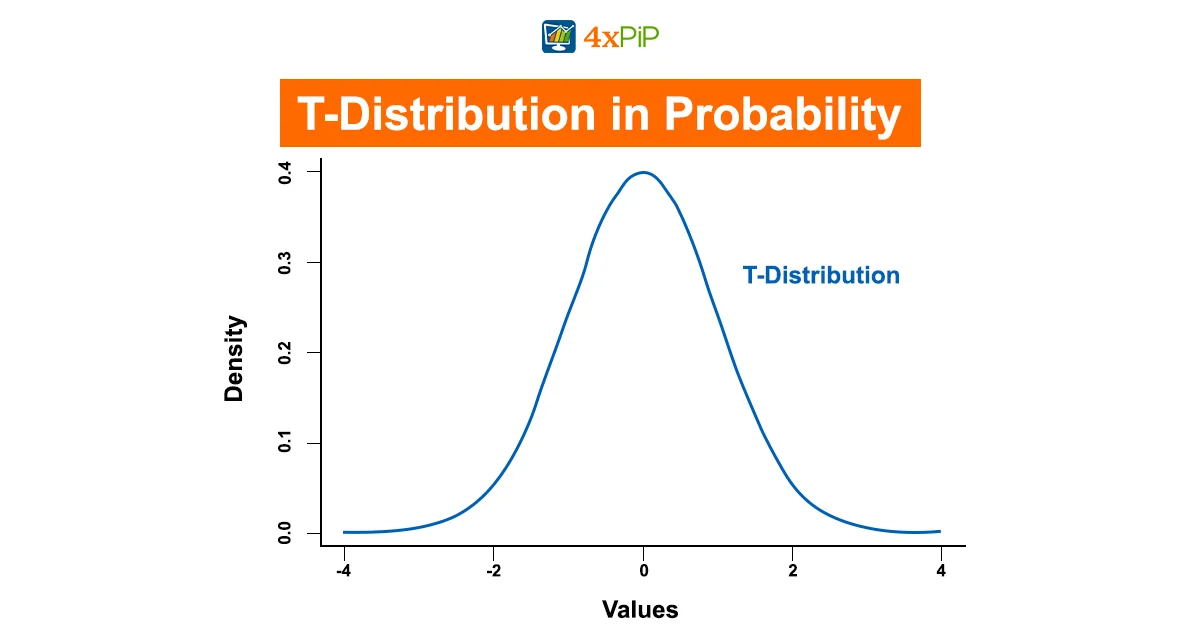
Explaining T-Distribution:
The T-Distribution is a probability distribution used for estimating population parameters when the sample size is small and the population standard deviation is unknown. It is crucial in scenarios where the Normal Distribution, with its larger sample size and known population standard deviation, doesn’t apply. The T-Distribution is characterized by its bell-shaped curve, like the Normal Distribution, but it has heavier tails, meaning it accommodates more extreme values. It’s essential in hypothesis testing, confidence intervals, and understanding the uncertainty of sample estimates. Understanding its shape and properties is fundamental for using it effectively in statistical analysis.
- The Shape of the T-Distribution: It resembles the Normal Distribution but has a more pronounced tail. As the degrees of freedom increase, It approaches the Normal Distribution.
- Degrees of Freedom: The degrees of freedom (df) are a critical factor in it. They determine the shape of the distribution and its variability. Higher df results in a distribution closer to the Normal Distribution.
- Use in Confidence Intervals: It is commonly used to calculate confidence intervals when population parameters are unknown. It provides a range of values within which a population parameter is likely to fall.
How To Use T-Distribution:
Now that we understand what the T-Distribution is, let’s delve into how to use it effectively. The T-Distribution is primarily employed when working with small sample sizes and when the population standard deviation (σ) is unknown. It allows us to estimate population parameters with a certain level of confidence. The following steps outline the process of using the T-Distribution:
Collect Data: Begin by gathering data from your sample. This data could represent any measurable quantity, including heights, test scores, or product measurements.
Calculate Sample Mean: Determine the sample mean (x̄) from the collected data. The sample mean is a key statistic that represents the average value within your sample.
Find Degrees of Freedom: Degrees of freedom (df) play a crucial role in shaping the T-Distribution. They are calculated as (n – 1), where ‘n’ represents the sample size. Higher degrees of freedom result in a T-Distribution that approximates the Normal Distribution.
Choose Confidence Level: Specify your desired confidence level. Common choices are 90%, 95%, or 99%. This level reflects how confident you want to be in the estimated parameter.
Find T-Score: Use a table or calculator to find the T-score corresponding to your chosen confidence level and degrees of freedom. The T-score serves as a critical factor in the calculation of confidence intervals.
Calculate Margin of Error: The T-score obtained in the previous step represents the margin of error for your estimation. To calculate the margin of error, multiply the T-score by the standard error (SE). The formula for the standard error is (s / √n), where ‘s’ is the sample standard deviation, and ‘n’ is the sample size.
Example:
Suppose you want to estimate the average height of a population using a sample of 15 individuals. After collecting the necessary data, you calculate the sample mean (x̄). With degrees of freedom (df) calculated as (15 – 1 = 14) and a chosen confidence level of 95%, you find the corresponding T-score. This T-score is used to calculate the margin of error. The final step involves adding and subtracting this margin of error from the sample mean to establish the confidence interval, within which the true population parameter is likely to fall.
T-Distribution vs Normal Distribution:
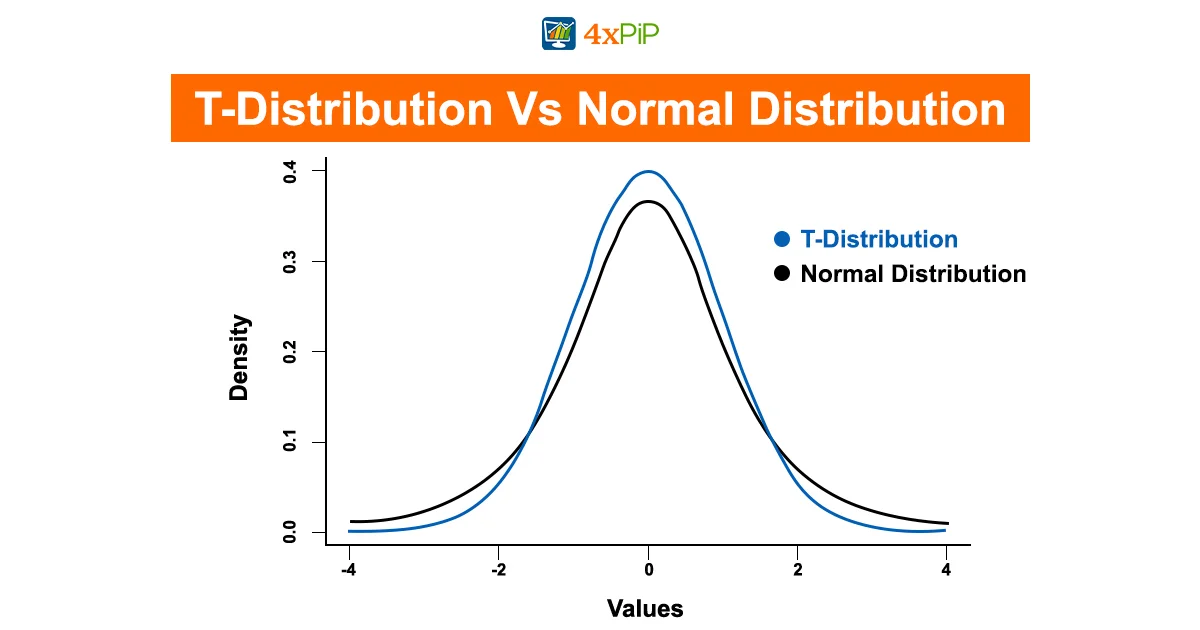
In statistical analysis, two commonly used tools are the T-Distribution and the Normal Distribution when dealing with probability distributions. Despite sharing similarities, they serve distinct purposes, and it is important to understand their differences.
T-Distribution:
The T-Distribution is a versatile distribution that shines when dealing with smaller sample sizes or situations where the population standard deviation is unknown. Its qualities include:
Sample Size Sensitivity: The T-Distribution is well-suited for situations with smaller sample sizes (typically n < 30). It becomes more like the Normal Distribution as the sample size increases.
Population Standard Deviation: It doesn’t assume knowledge of the population standard deviation (σ) and instead relies on the sample standard deviation (s).
Tail Thickness: The T-Distribution features thicker tails, making it more accommodating to extreme values or outliers in the data.
Degrees of Freedom Impact: The shape and variability of the T-Distribution are heavily influenced by degrees of freedom (df), which are calculated as (n – 1), where n is the sample size.
Normal Distribution
In contrast, people commonly use the Normal Distribution, also known as the Gaussian Distribution, to exhibit different characteristics when:
Sample Size: It is ideal for larger sample sizes (typically n > 30), where it provides a good approximation of the data distribution.
Population Standard Deviation: The Normal Distribution assumes knowledge of the population standard deviation (σ).
Tail Behavior: This distribution features thinner tails, which means it’s less accommodating to extreme values and outliers.
Degrees of Freedom Independence: Degrees of freedom do not impact the Normal Distribution, and it retains its characteristic shape regardless of sample size.
Understanding the distinctions between the T-Distribution and the Normal Distribution is crucial for choosing the appropriate distribution to use in statistical analysis, depending on the specific characteristics of the data and the problem at hand.
The Limitations:
The T-Distribution, a useful tool in statistics, has its limitations. Firstly, it is particular about the shape of your data, preferring it to resemble a classic bell curve. If your data is scattered or oddly shaped, using the Probability may not yield reliable results. In such cases, it is advisable to check if your data aligns with the T-Distribution’s preferences or explore alternative methods better suited to your data.
Another limitation involves the sample size. While the T-distribution performs well with small datasets, it can behave erratically with extremely tiny samples, making it challenging to draw solid conclusions. For such minuscule datasets, considering specialized statistical methods designed for small samples, such as the Wilcoxon signed-rank test, can provide more dependable results.
Lastly, although the T-Distribution handles extreme values better than the Normal Distribution, it is not the optimal choice for highly skewed or irregularly distributed data. If your data exhibits significant skewness or deviates from the classic bell curve, opting for other distributions like the Chi-Square Distribution or non-parametric tests becomes more appropriate. Understanding the limitations of the helps in selecting the right statistical tool for your unique dataset, ensuring more accurate results.
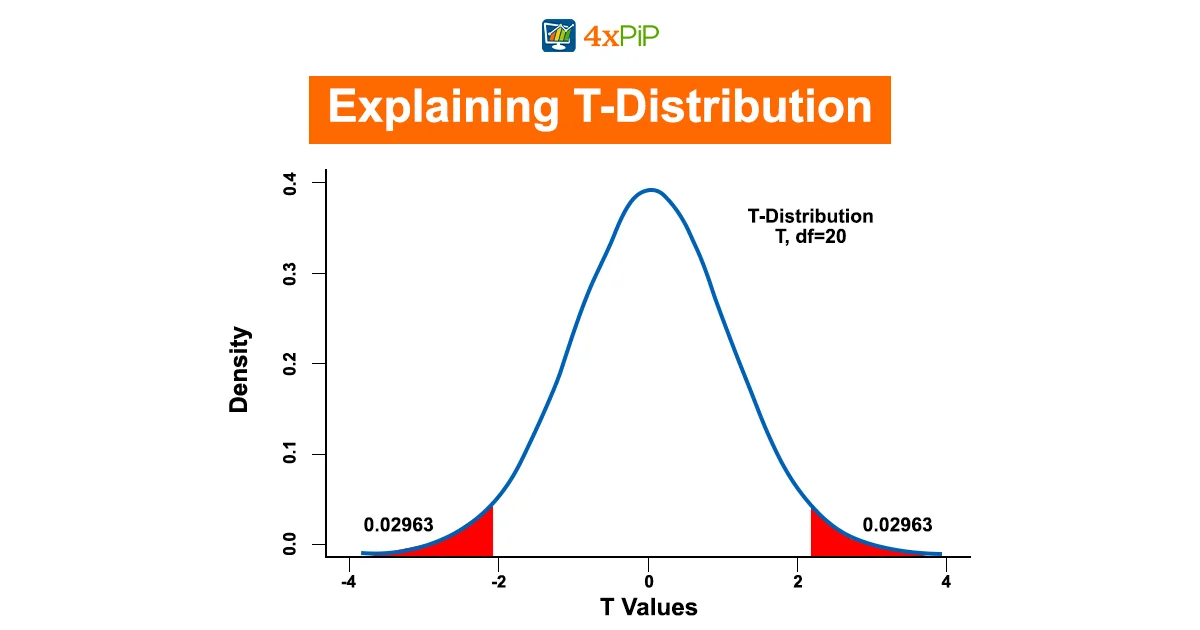
Hypothesis Testing with T-Distribution:
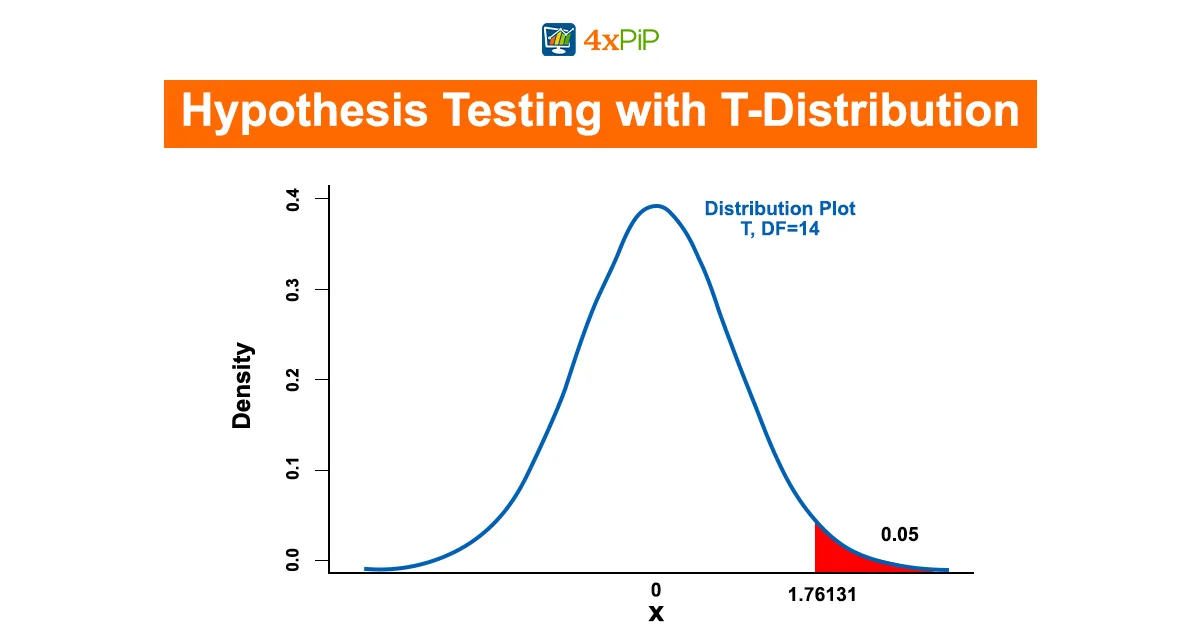
In the world of statistics, hypothesis testing is a fundamental process. It involves making educated guesses about population parameters based on sample data. The T-Distribution plays a significant role in hypothesis testing, particularly when dealing with smaller sample sizes and unknown population standard deviations. Let’s explore how researchers utilize the T-Distribution in hypothesis testing.
Hypothesis Testing with T-Distribution:
Hypothesis testing is a critical component of statistical analysis. It involves assessing data to make informed conclusions about population parameters based on sample information. The T-Distribution plays a vital role in this process, especially in scenarios where sample sizes are small, and the population standard deviation is unknown.
How hypothesis testing with the T-Distribution works:
Formulate Hypotheses: Begin by formulating a null hypothesis (H0) and an alternative hypothesis (H1). The null hypothesis often represents the status quo or no effect, while the alternative hypothesis represents the effect you want to test.
Collect Data: Gather sample data that relates to your hypothesis.
Calculate Test Statistic: Compute a test statistic using the T-Distribution. The test statistic typically compares sample data to the null hypothesis.
Determine Critical Region: Establish a significance level (α) to determine the critical region of the T-Distribution. The critical region represents extreme values that lead to rejecting the null hypothesis.
Compare Test Statistic: Compare the calculated test statistic with the critical values from the T-Distribution. If the test statistic falls within the critical region, you reject the null hypothesis.
Draw Conclusions: Based on the comparison, make a statistical decision and draw conclusions about the null hypothesis.
Accurately performing statistical analysis, especially in situations with limited sample sizes and uncertain population standard deviations, requires a fundamental understanding of how to use in hypothesis testing.
Summary:
The T-Distribution, commonly referred to as the Student’s, plays a vital role in this field. In this blog, we have explored the T-Distribution, elucidating its explanation, practical usage, and distinctions from the Normal Distribution. Additionally, having delved into its significance in hypothesis testing and addressed its limitations, understanding the empowers statisticians and researchers to draw accurate inferences. This is particularly crucial in scenarios involving smaller sample sizes and unknown population standard deviations. Furthermore, this knowledge holds paramount importance in fields such as statistics, economics, and science, where precise data analysis is essential.
FAQ’s
What is the T-Distribution used for in statistics?
In dealing with small sample sizes and unknown population standard deviations, practitioners use the T-Distribution to estimate population parameters.
How does the T-Distribution differ from the Normal Distribution?
The T-Distribution better suits smaller sample sizes and situations where the population standard deviation is unknown, while the Normal Distribution is ideal for larger sample sizes with a known standard deviation.
What are the degrees of freedom in the T-Distribution?
Degrees of freedom (df) in the T-Distribution determine its shape and variability. Calculate them as (sample size – 1).
What is the significance of the T-Score in the T-Distribution?
The T-Score, obtained from the T-Distribution, is crucial for calculating confidence intervals and making statistical decisions.
When should I use the T-Distribution for hypothesis testing?
The T-Distribution is particularly useful in hypothesis testing when dealing with smaller sample sizes and uncertain population standard deviations.
How do I calculate the degrees of freedom for the T-Distribution?
To calculate degrees of freedom, subtract 1 from the sample size (df = n – 1).
What is a confidence level in the T-Distribution?
A confidence level represents how confident you want to be in the estimated parameter. Common choices are 90%, 95%, or 99%.
What is the role of the T-Distribution in drawing confidence intervals?
Users employ the T-Distribution to calculate confidence intervals, providing a range of values within which a population parameter is likely to fall.
Can the T-Distribution handle extreme values and outliers in data?
Indeed, the T-Distribution accommodates extreme values and outliers more effectively than the Normal Distribution, primarily due to its thicker tails. This characteristic makes it particularly useful in situations where data may deviate from the typical bell-shaped curve.
What are the key applications of T-Distribution in real-world scenarios?
People widely use the T-Distribution in various fields, including science, economics, and statistics, for tasks like calculating confidence intervals, hypothesis testing, and understanding the uncertainty of sample estimates.