In the dynamic world of trading, grasping fundamental concepts like support and resistance is paramount. These terms, foundational in technical analysis, hold the key to interpreting price charts accurately. This article, brought to you by 4xPip, dives into the core of support and resistance, unraveling their significance for traders of all levels.
Introduction to Support and Resistance:
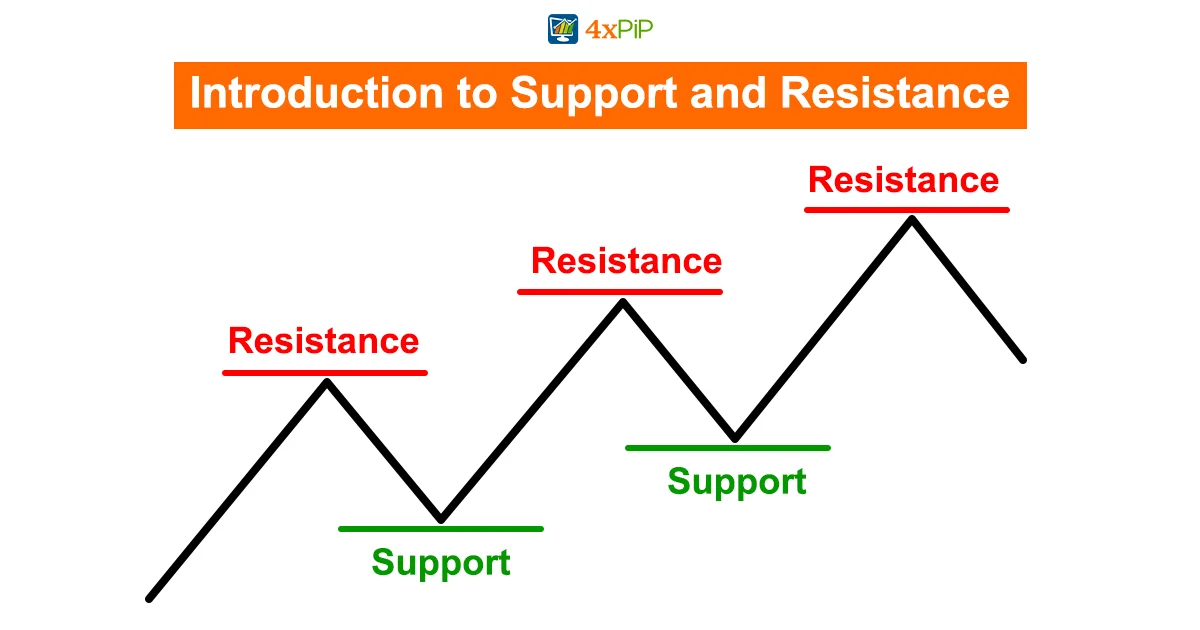
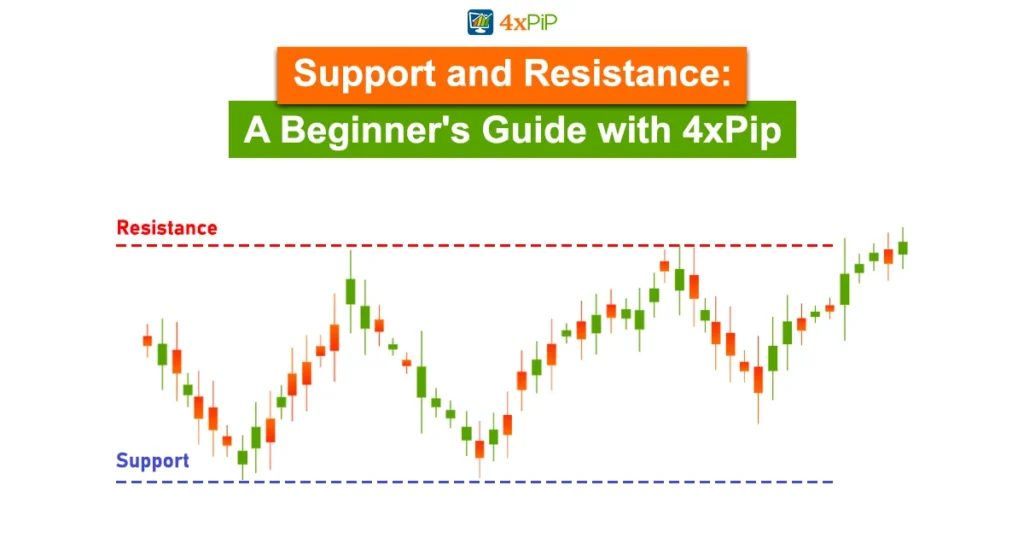
In the intricate dance of market forces, prices sway due to the delicate balance between supply and demand. When demand exceeds supply, prices ascend; when supply outstrips demand, prices descend. At times, prices tread water, moving sideways as equilibrium is achieved. This fundamental principle sets the stage for comprehending support and resistance.
Key Takeaways:
- Technical analysts use these levels to identify potential pauses or reversals in trends.
- Support marks a point where a downtrend may halt due to concentrated demand.
- Resistance signifies a potential pause in an uptrend due to concentrated supply.
- Market psychology, shaped by past experiences, plays a crucial role in these dynamics.
What Is Support?
During a downtrend, as prices decline due to excess supply, a point is reached where demand begins to match supply. This inflection point, known as support, signifies an area on the chart where buyers show a strong willingness to purchase. Here, demand triumphs over supply, arresting the decline and initiating a potential reversal
Practical Application:
- Support can manifest as a specific price level or a broader price zone.
- Traders observe past support levels, anticipating similar reactions in the future.
- 4xPip provides tools and robots for auto trading, enhancing trading efficiency.
Promotional Element:
In this article, 4xPip brings deep insights into support, a critical concept for traders. For advanced tools and guidance, explore 4xPip’s offerings at 4xPip.
What Is Resistance?
Conversely, resistance emerges during an uptrend when demand surpasses supply, pushing prices higher. At a certain point, selling pressure overwhelms buying enthusiasm, creating a barrier known as resistance. This level, visible on a price chart, indicates where supply starts to dominate, leading to a potential pause in the upward movement.
Strategic Insights:
- Recognizing support or resistance levels aids in entry and exit points.
- Traders bet on price directions based on respecting or breaking these levels.
Practical Application:
Explore 4xPip’s Stoploss MT4 EA and Stoploss MT5 EA for efficient risk management.
The Basics of Support and Resistance:
Support and resistance aren’t confined to specific timeframes; they permeate daily, weekly, and monthly charts. Traders identify these levels by examining historical pauses in price movements and anticipate similar reactions in the future.
Technical Nuances:
- Support and resistance levels are sometimes referred to as zones.
- Flexibility is crucial as prices may briefly dip below or reverse before reaching these levels.
Real-world Insight:
Market participants often react similarly to information, making these price levels significant.
User Engagement:
Connect with 4xPip’s experts at [email protected] for personalized guidance.
Trendlines: Unveiling Dynamic Price Barriers:
In trading, trendlines play a pivotal role in illustrating support and resistance. As markets trend upward or downward, trendlines provide a visual representation of dynamic barriers that influence price movements.
Market Dynamics:
- Trendlines act as static barriers preventing price movements.
- Support and resistance strength increases with the frequency of historical touches.
Application:
Observe how trendlines supported Newmont Corp. (NEM) shares over an extended period.
Strategic Tip:
- Valid trendlines require at least three touches, ensuring reliability in trend analysis.
- Round Numbers and Psychological Barriers
Round numbers, such as $50 or $100 per share, often present formidable barriers to asset prices. Traders and investors are psychologically inclined to react around these round figures, creating strong support or resistance levels.
Behavioral Aspect:
- Inexperienced traders tend to buy or sell at round numbers for ease of visualization.
- Target prices and stop orders frequently cluster around round price levels.
User Engagement:
Explore 4xPip’s tools for precise entry and exit points in such critical price zones.
Moving Averages: Riding the Momentum Wave:
Traders leverage technical indicators like moving averages to predict short-term momentum. These indicators, especially moving averages, provide automatic support and resistance levels.
Versatile Application:
- Moving averages aid in anticipating price movements and deciding optimal exit points.
- Experiment with different periods for moving averages to align with your trading style.
Strategic Insight:
Gain a competitive edge by incorporating moving averages into your trading toolkit.
Other Indicators: Unveiling Complex Insights:
Technical analysis introduces a plethora of indicators, each offering unique insights into support and resistance. While seemingly complex, the application of these indicators aligns with simpler methods like drawing trendlines and calculating moving averages.
Fibonacci Retracement:
- A favorite among short-term traders, it identifies potential support/resistance levels.
- Levels calculated by this indicator act as barriers to short-term price directions.
Engagement Tip:
For expert guidance on using diverse indicators, connect with 4xPip’s knowledgeable team.
Trading Ranges: Navigating Sideways Trends:
In the realm of support and resistance, trading ranges pose a unique challenge. These periods, marked by closely positioned support levels, create opportunities for experienced traders.
Strategic Approach:
- Experienced traders navigate within trading ranges, taking advantage of price oscillations.
- Caution is advised; wait for a breakout before placing trades in the trending direction.
Support and Resistance Reversals: An Intricate Dance:
Levels that once served as support may transition and vice versa. Understanding the intricacies of these reversals adds depth to traders’ comprehension of market dynamics.
Chart Analysis:
- Traders visually identify areas of support and resistance through price charts.
- Number of touches, preceding price moves, volume, and time impact level significance.
User Insight:
Market psychology influences these levels, reflecting the emotional nature of traders.
Conclusion:
In the ever-evolving landscape of trading, mastering support and resistance provides a solid foundation. 4xPip, your partner in navigating financial markets, offers expert insights, tools, and robots to enhance your trading journey. For tailored guidance, reach out to 4xPip’s experts at [email protected].
Pro Tip:
Continuously refine your understanding of support and resistance for informed trading decisions.