In the dynamic realm of trading, understanding the Relative Strength Index (RSI) is vital. Crafted by J. Welles Wilder Jr. in 1978, the RSI acts as a potent momentum indicator, gauging recent price changes on a scale from 0 to 100. Here at 4xPip, we acknowledge its significance in providing short-term buy and sell signals, aiding traders in navigating the market’s complexities.
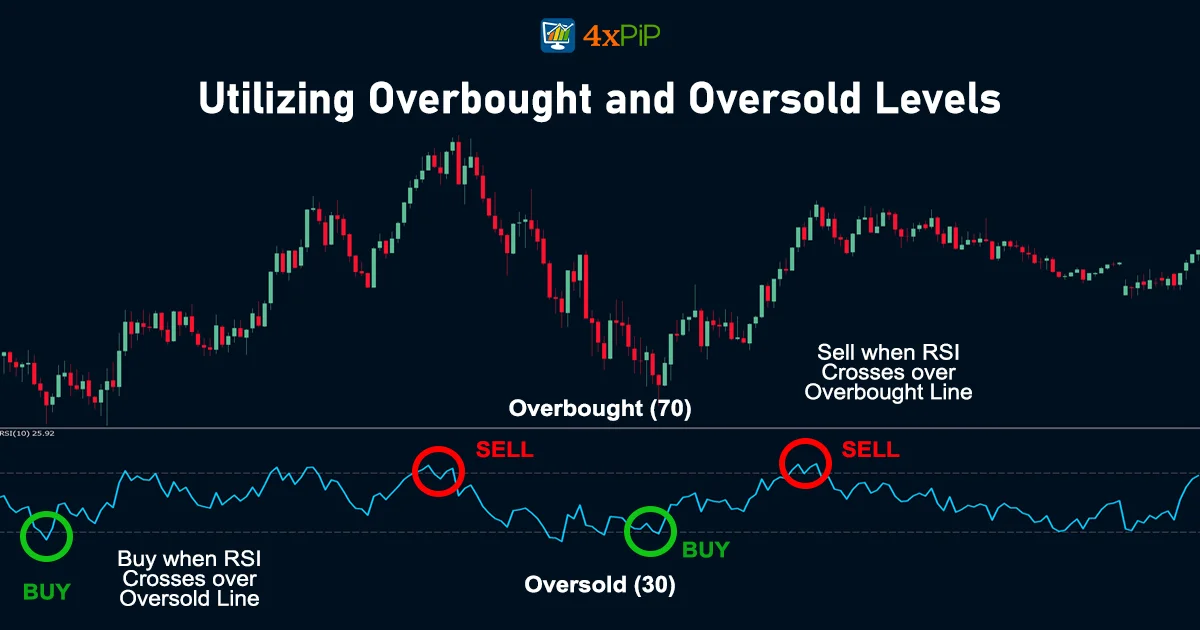
Utilizing Overbought and Oversold Levels:
Low RSI Levels: Buy Signals and Undervalued Conditions:
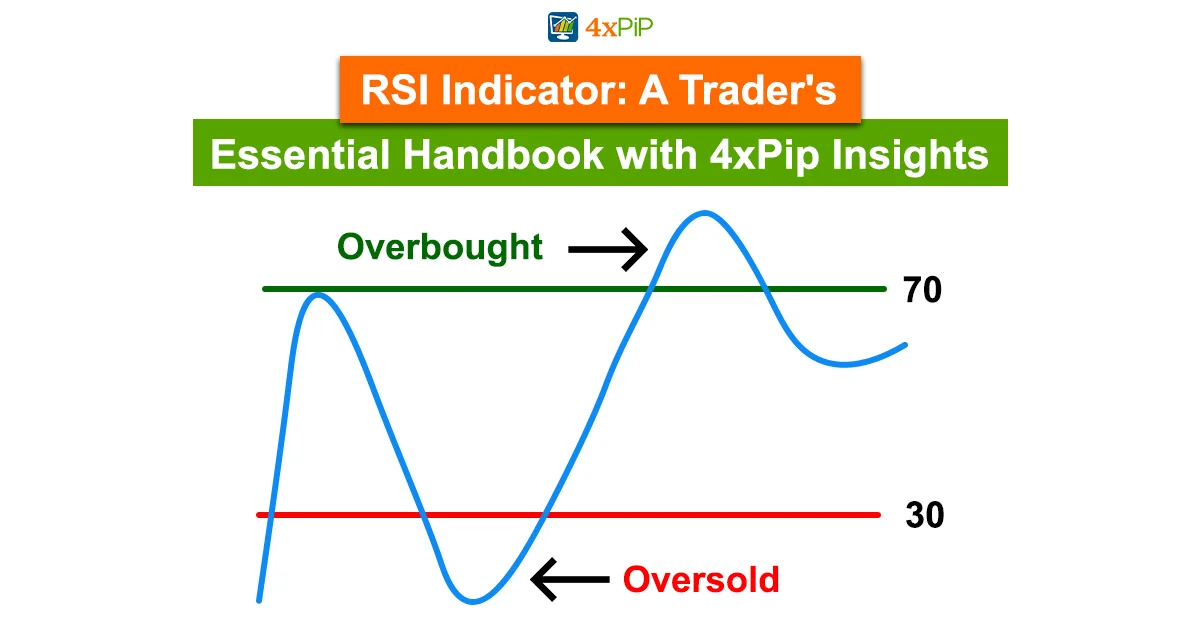
When the RSI Indicator drops below 30, it’s like a market tap on your shoulder, suggesting a potential buying opportunity. It indicates that a stock might be oversold or undervalued, making it an opportune time to consider entering the market. At 4xPip, we advise traders to seize this moment, recognizing it as a chance to enter the market strategically and possibly benefit from an upcoming price increase.
High RSI Levels: Sell Signals and Overbought Securities:
On the flip side, additionally, an RSI above 70 sends out sell signals, waving a caution flag that a security may be overbought or overvalued. Moreover, it’s a crucial indicator for traders to note, as it suggests a potential downturn in the stock’s price. Here at 4xPip, we emphasize the importance of recognizing these signals to make informed decisions and protect your investments from possible losses.
Insights into Divergence and Oscillators:
Divergence: Reading the Signals:
The positive and negative divergence between the price and the RSI indicator oscillator can offer valuable insights. At 4xPip, we stress the importance of understanding these signals. Positive divergence occurs when the RSI is on the rise while the price hits a new low. This can indicate a potential rally. On the other hand, negative divergence happens when the price reaches a new high, but the RSI hits a new low. This warns of a possible selloff.
Failure Swings: Identifying Reversals:
Failure swings, occurring during both uptrends and downtrends, act as signals for potential reversals. Recognizing these swings can be a game-changer for investors. At 4xPip, we guide traders on leveraging failure swings to enhance their decision-making process. For instance, a Failure Swing Top occurs when the asset’s price reaches a high point, but the RSI drops below the recent swing low. This can be a signal to sell the asset. Conversely, a Failure Swing Bottom occurs when the price hits a low point, but the RSI jumps above the recent swing high, indicating a potential buying opportunity.
Mastering RSI Ranges:
Overbought and Oversold Dynamics in Uptrends and Downtrends:
In uptrends, the RSI tends to stay above 30, frequently hitting 70. Conversely, during downtrends, it rarely exceeds 70, often dropping below 30. At 4xPip, we educate traders on interpreting these RSI ranges to determine trend strength and potential reversals. For instance, during an uptrend, if the RSI consistently fails to reach 70 on consecutive price swings but then drops below 30, it signals a weakened trend that might be reversing lower. The reverse is true for a downtrend.
RSI Trendline Breaks: Identifying Shifts:
Breaking through trendlines in RSI can signal significant shifts in market dynamics. Understanding these breaks is vital for traders. At 4xPip, we emphasize the need to pay attention to RSI trendline breaks to make timely and informed decisions. These breaks can indicate a change in the trend direction, serving as a valuable tool for traders to adjust their strategies accordingly.
Comparing Momentum Indicators: RSI vs. MACD:
MACD: Another Tool in Your Arsenal:
In addition to RSI, traders often use the Moving Average Convergence Divergence (MACD). At 4xPip, we provide insights into how these two indicators complement each other, offering a more comprehensive understanding of market momentum. Both indicators help traders identify potential buy and sell signals. For example, when the MACD crosses above its signal line, it may indicate a bullish trend, prompting traders to consider buying the security.
Conclusion:
In this comprehensive guide, we’ve delved into the nuances of the RSI indicator, offering valuable insights to traders of all levels. At 4xPip, we encourage you to apply this knowledge, and for further guidance and advanced trading tools, explore our website or reach out to our experts at [email protected]. Mastering the RSI is a key step toward becoming a more confident and successful trader in the dynamic world of trading.


