In the fast-paced world of trading, having the right tools is like having a reliable compass. One such tool that has gained traction is the Average Directional Index (ADX). Developed by Welles Wilder for commodity daily charts, the ADX has become a go-to for traders in various markets. In this in-depth guide, 4xPip aims to unravel the complexities of the ADX, making it accessible to both beginners and seasoned traders alike.
Understanding the Average Directional Index (ADX):
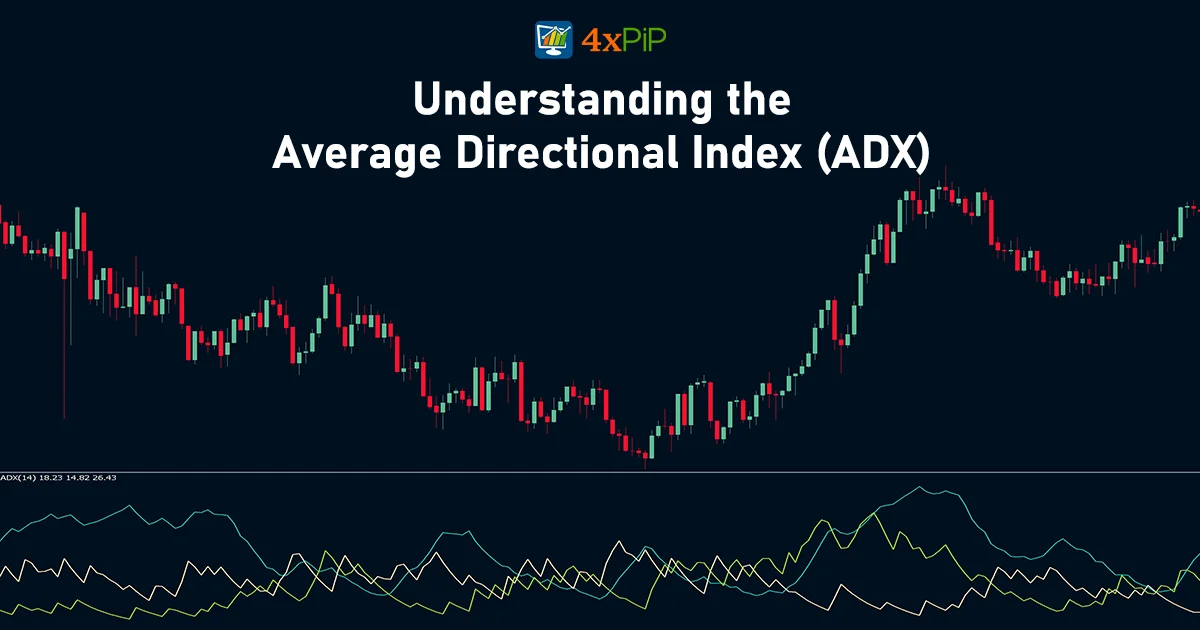
The ADX is like a weather vane for traders, helping them understand the strength of a trend. It uses three main components: the positive directional indicator (+DI), the negative directional indicator (-DI), and the ADX line. Think of them as the arrows pointing you in the direction of potential profits. If +DI is leading, it might be time to go long; if -DI takes charge, short might be the way to go.
The Formula Unveiled:
Now, let’s lift the curtain on the ADX formula. It involves juggling with +DI, -DI, and a bunch of other acronyms, but at its core, it’s about measuring trend strength and direction. The process may seem like a financial magic trick, but it empowers traders to make wiser decisions by understanding market trends more deeply.
Crunching the Numbers:
Calculating the ADX involves a step-by-step process that resembles solving a puzzle. From figuring out +DM and -DM to smoothing those averages, each piece contributes to the big picture of market trends. The ADX becomes your market detective, identifying a strong trend (ADX > 25) or a weak one (ADX < 20). Crossovers between -DI and +DI become your trading signals, telling you when to buy or sell.
Decoding the Signals:
What’s the ADX trying to tell you? Well, it’s like a market fortune teller. It helps you gauge the strength of the trend and gives you hints on when to enter or exit a trade. If the ADX is over 25, it’s saying, “Hey, strong trend alert!” And if it’s below 20, it’s whispering, “Trendless waters, tread carefully.” Pay attention to crossovers between -DI and +DI—they might be the secret code to profitable trades.
Adventures with ADX vs. Aroon:
Now, let’s meet ADX’s friend, Aroon. Both are like superheroes trying to save traders from market chaos. While they share the goal of identifying trends, ADX has three lines, and Aroon has two. It’s like comparing a tricycle (ADX) to a bicycle (Aroon). Traders need to pick the one that suits their ride through the trading landscape.
Pros and Cons of the ADX:
Like any superhero, the ADX has strengths and weaknesses. Let’s break it down:
Pros:
Trend Strength Indicator: ADX tells you how strong a trend is. Powerful information!
Clear Signals: Crossovers between -DI and +DI can be crystal clear trading signals.
Cons:
False Alarms: ADX can give frequent signals, and not all may lead to treasure. Be cautious.
Temporary Highs: Sometimes, ADX hits 25 but takes a U-turn. It’s like a rollercoaster—hold on tight!
Conclusion:
Mastering the Average Directional Index is like having a treasure map in the world of trading. 4xPip has provided a user-friendly guide, breaking down the ADX intricacies into bite-sized pieces. Remember, combine ADX with other tools, keep an eye on market changes, and sail through the trading seas with confidence. For more insights and access to cutting-edge tools, visit 4xPip’s website. Reach out to their experts at [email protected]—they’re your trading allies. Happy trading adventures!