In this article, 4xPip has discussed an unknown but the most reliable indicator called McGinley Dynamic Indicator. For detailed information about this indicator, read the whole article. 4xPip has also provided information on other indicators, you can read them through this link.
McGinley Dynamic Indicator:

The McGinley Dynamic indicator is a little-known but highly reliable technical indicator invented by John R. McGinley, a chartered market technician and former editor of the Market Technicians Association’s Journal of Technical Analysis. McGinley developed the indicator in the 1990s to address the limitations of traditional moving averages, which can lag behind the market and generate false signals.
The McGinley Dynamic indicator is a type of moving average that automatically adjusts itself to the speed of the market. It does this by using a filter to smooth the price data and avoid whipsaws. The indicator is calculated using a 10-day simple moving average and a 10-day exponential moving average.
The McGinley Dynamic indicator identifies trends, generates buy and sell signals, and sets stop-loss and take-profit levels. It is particularly useful in volatile markets, where it can help investors to avoid false signals.
key benefits of using the McGinley Dynamic indicator:
- It is responsive to market movements. The McGinley Dynamic indicator automatically adjusts itself to the speed of the market, so it is less likely to lag or generate false signals.
- It is smooth and less prone to whipsaws. The McGinley Dynamic indicator uses a filter to smooth the price data, which helps to reduce the noise and make the indicator easier to interpret.
- It is easy to use and understand. The McGinley Dynamic indicator is calculated using a simple formula, and it can be easily plotted on any charting platform.
Tips for using the McGinley Dynamic indicator:
- Use it to identify trends. The McGinley Dynamic indicator can be used to identify trends by looking for a crossover of the indicator above or below the price. For example, a crossover of the indicator above the price can signal a bullish trend, while a crossover of the indicator below the price can signal a bearish trend.
- Use it to generate buy and sell signals. The McGinley Dynamic indicator can also be used to generate buy and sell signals by looking for crossovers of the indicator above or below a moving average. For example, a crossover of the indicator above a 20-day moving average can signal a buy signal, while a crossover of the indicator below a 20-day moving average can signal a sell signal.
- Use it to set stop-loss and take-profit levels. The McGinley Dynamic indicator can also be used to set stop-loss and take-profit levels. For example, a trader can place a stop-loss order below the previous swing low of the indicator, and a take-profit order above the previous swing high of the indicator.
It is important to note that no technical indicator is perfect, and the McGinley Dynamic indicator is no exception. Use this indicator in conjunction with other technical indicators and fundamental analysis to confirm signals and reduce the risk of false signals.
SMA vs EMA:
A simple moving average (SMA) is a technical indicator that smooths out price action by calculating the average closing price over a specified period. For example, a 10-day SMA is calculated by adding the closing prices of the last 10 days and dividing by 10. The longer the period, the smoother the SMA will be, but the slower it will react to changes in price.
An exponential moving average (EMA) is a type of moving average that gives more weight to recent prices than to older prices. This makes EMAs more responsive to changes in price than SMAs. Investors use EMAs to identify short-term trends and to make trading decisions.
The Problems with Moving Averages:
In his research, John McGinley found that moving averages had several problems. First, they were often applied inappropriately. Moving averages with different periods behave differently in different markets. For example, how can you know whether to use a 10-day, 20-day, or 50-day moving average in a fast or slow market? To solve the problem of choosing the right length of moving average, McGinley developed the McGinley Dynamic, which automatically adjusts to the current speed of the market.
McGinley also believed that moving averages should only be used as a smoothing mechanism, not as a trading system or signal generator. Moving averages are best used to monitor trends. McGinley also found that moving averages often failed to follow prices, with large separations frequently existing between prices and moving average lines. He sought to eliminate these problems by inventing an indicator that would hug prices more closely, avoid price separation and whipsaws, and follow prices automatically in fast or slow markets.
In simpler terms, moving averages are a popular technical indicator, but they have some problems. They can be difficult to use correctly, and they don’t always follow prices closely. John McGinley developed the McGinley Dynamic to address these problems. The McGinley Dynamic is a moving average that automatically adjusts to the current speed of the market, and it hugs prices more closely.
The McGinley Dynamic Formula:
in the 1990s, John McGinley developed McGinley Dynamic formula that is a technical indicator. It addresses some of the shortcomings of traditional moving averages, such as lag and price separation. The formula is as follows:
MD_i = MD_{i-1} + k * N * (MD_{i-1} – Close_i)^4 / (Close_i – MD_{i-1})
where:
MD_i is the current McGinley Dynamic
MD_{i-1} is the previous McGinley Dynamic
Close_i is the closing price
k is a constant, typically set to 0.6
N is the length of the moving average period
To calculate the McGinley Dynamic, take the previous McGinley Dynamic and add to it a weighted average of the difference between the previous McGinley Dynamic and the closing price. Determine the weight by dividing the difference between the previous McGinley Dynamic and the closing price by the difference between the closing price and the previous McGinley Dynamic. Raise this ratio to the fourth power to give the McGinley Dynamic a greater sensitivity to recent price changes.
How Does the McGinley Dynamic Work?
The McGinley Dynamic is a smoothing indicator, but it is also responsive to recent price changes. This is because of the way the weight is calculated. When the difference between the previous McGinley Dynamic and the closing price is large, the weight will be large, and the McGinley Dynamic will move closer to the closing price. Conversely, when the difference between the previous McGinley Dynamic and the closing price is small, the weight will be small, and the McGinley Dynamic will move more slowly.
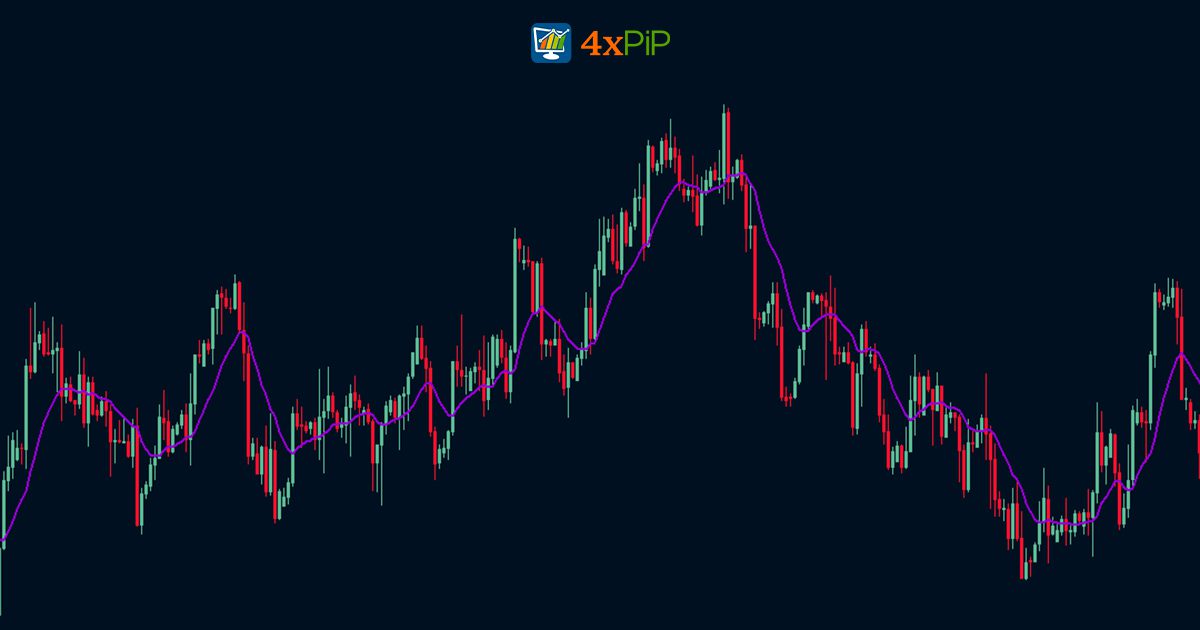
This makes the McGinley Dynamic a good indicator for identifying trends and reversals. When the McGinley Dynamic is moving above the closing price, it is a sign that the trend is bullish. Conversely, when the McGinley Dynamic is moving below the closing price, it is a sign that the trend is bearish.
How to Use the McGinley Dynamic?

The McGinley Dynamic can be used in a variety of ways. Some traders use it to identify trends, while others use it to generate trading signals.
To identify trends, investors can look for crosses between the McGinley Dynamic and the closing price. When the McGinley Dynamic crosses above the closing price, it is a sign that the trend is turning bullish. Conversely, when the McGinley Dynamic crosses below the closing price, it is a sign that the trend is turning bearish.
To generate trading signals, traders can use the McGinley Dynamic as support and resistance levels. When the McGinley Dynamic is acting as support, it can be a good time to buy. Conversely, when the McGinley Dynamic is acting as resistance, it can be a good time to sell.
Summary:
The McGinley Dynamic indicator is a technical indicator that addresses the shortcomings of traditional moving averages. It is a smoothing indicator that is also responsive to recent price changes, making it a good indicator for identifying trends and reversals.
Traders can use the McGinley Dynamic indicator to identify trends by looking for crosses between the indicator and the closing price. When the indicator crosses above the closing price, it is a sign that the trend is turning bullish. Conversely, when the indicator crosses below the closing price, it is a sign that the trend is turning bearish.
Investors can also use the McGinley Dynamic indicator to generate trading signals by using it as support and resistance levels. When the indicator is acting as support, it can be a good time to buy. Conversely, when the indicator is acting as resistance, it can be a good time to sell.
The McGinley Dynamic indicator is a versatile tool that traders of all experience levels use to identify trends, generate trading signals, and set stop-loss and take-profit levels.