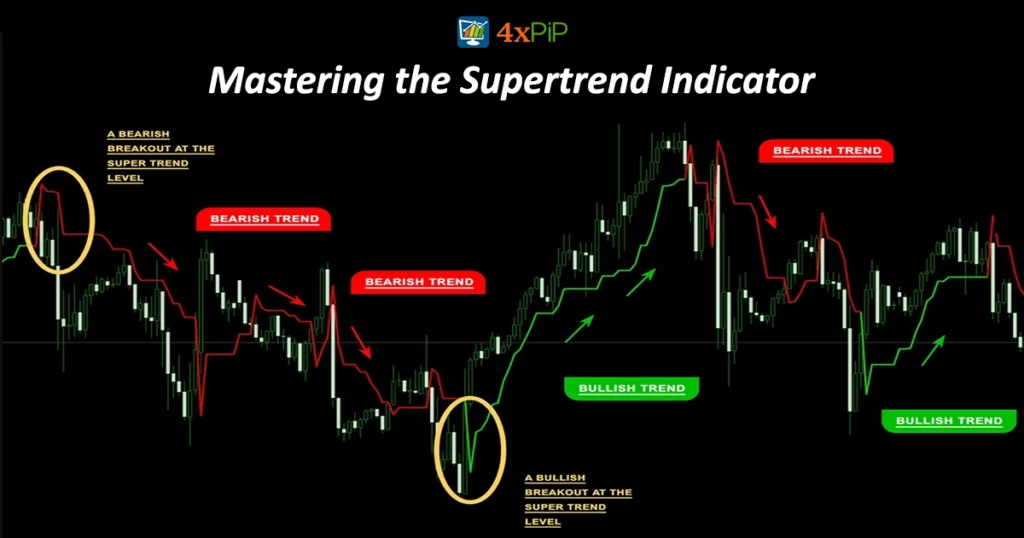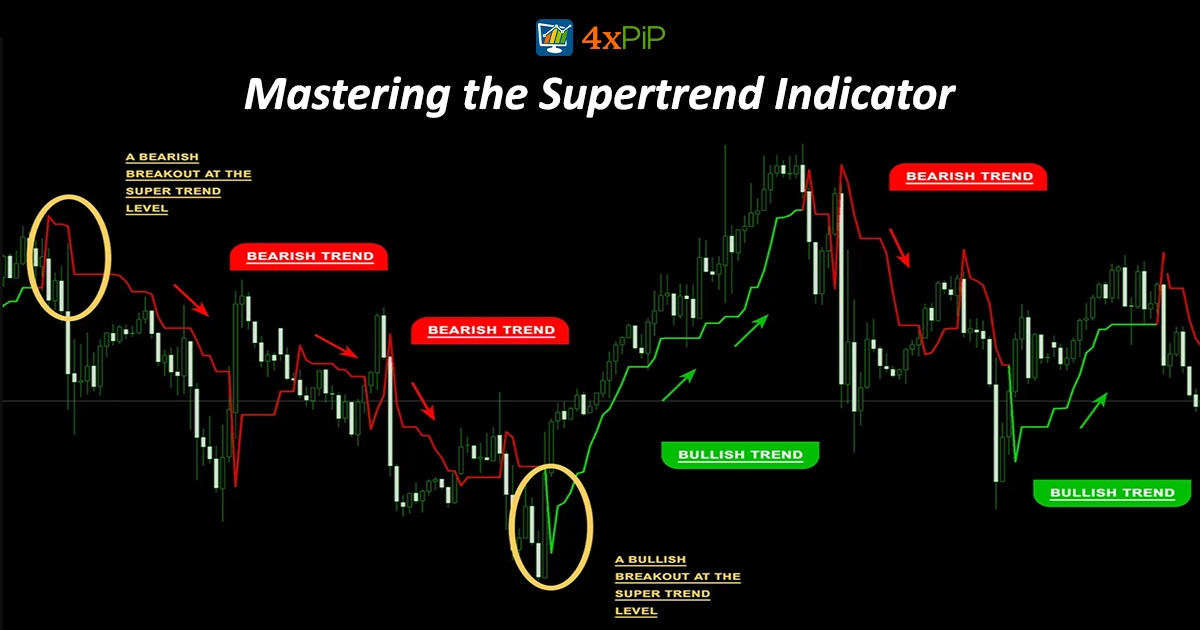
Understanding the Supertrend Indicator:
The Supertrend Indicator, developed by Olivier Seban, is a vital tool for traders seeking market trends in stocks, currencies, and commodities. By plotting a dynamic line on price charts, it serves as a guide for entry and exit points.
How the Supertrend Indicator Works:
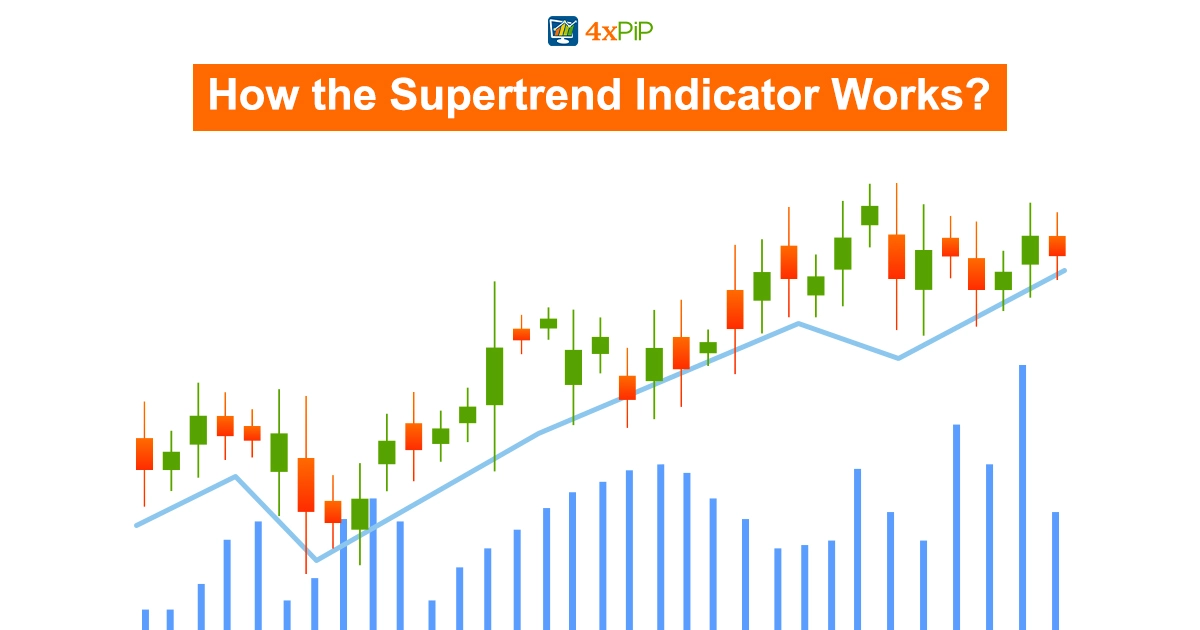
Derived from the average true range (ATR) and a multiplier, the Supertrend Indicator calculates its value by adjusting an asset’s closing price. When the price is above the line, it signals an upward trend—ideal for buying. Conversely, below the line indicates a downward trend, signaling a sell opportunity.
Calculating the Supertrend Indicator:
The formula, Supertrend=(High+Low)/2+(Multiplier)∗(ATR), incorporates high and low prices, ATR for market volatility, and a chosen multiplier. This formula adapts the Supertrend Indicator to different assets, time frames, and market conditions.
Using the Supertrend Indicator Effectively:
Traders leverage the Supertrend Indicator to identify trends, manage risk, and confirm market tendencies. When combined with other technical indicators, it becomes a powerful tool for crafting a comprehensive trading strategy.
Importance of the Supertrend Indicator:
The Supertrend Indicator is valued for its simplicity, dynamic support and resistance levels, trend identification, adaptability to different market conditions, risk management capabilities, and versatility across various asset classes.
Limitations of the Supertrend Indicator:
Despite its benefits, the Supertrend Indicator has limitations, including its lagging nature, susceptibility to false signals in choppy markets, sensitivity settings challenges, reliance on additional indicators for a complete strategy, and potential variance in effectiveness across asset classes.
Using the Supertrend Indicator in Practice:
Traders use the Supertrend Indicator to pinpoint entry and exit points, set stop-loss levels, confirm trends, and allocate assets. Combining it with other technical indicators enhances its reliability and effectiveness.
Example of Using the Supertrend Indicator:
Illustrated with the QQQ ETF on a daily chart, a Supertrend strategy showcases its potential effectiveness. Backtesting and optimization are crucial before relying on the indicator for predictive power.
Comparing the Supertrend Indicator with the ATR:
While both incorporate the ATR, the Supertrend Indicator focuses on trend identification and trading signals, while the ATR measures market volatility. Understanding this difference is key for effective utilization.
Assessing the Reliability of the Supertrend Indicator:
The reliability of the Supertrend Indicator depends on factors such as market conditions, asset types, and individual investment goals. It should be part of a broader trading strategy, not a stand-alone solution.
Exploring Similar Indicators:
Several indicators, like the MACD, parabolic stop and reverse, Bollinger Bands, Keltner Channels, and the Ichimoku Cloud, share similarities with the Supertrend Indicator. Exploring these options enhances the trader’s toolkit.
Choosing the Right Time Frame for the Supertrend Indicator:
The best time frame for the Supertrend Indicator varies based on strategy, risk tolerance, and the specific asset. No one-size-fits-all approach exists; customization is key.
Enhancing Supertrend Signals with Other Indicators:
Pairing the Supertrend Indicator with moving averages, RSI, Bollinger Bands, MACD, volume indicators, stochastic oscillator, Fibonacci retracement levels, and the Ichimoku Cloud improves signal accuracy and builds a robust trading strategy.
The Bottom Line on the Supertrend Indicator:
The Supertrend Indicator, a versatile tool for trend-following, is a staple in various financial markets. While providing clear signals for trend direction, it must be integrated into a comprehensive trading approach for optimal effectiveness.
Conclusion:
In conclusion, mastering the Supertrend Indicator is key to navigating the dynamic world of trading. Its simplicity, adaptability, and versatility make it a valuable asset. Remember, it’s most effective when part of a well-rounded strategy that combines various technical indicators.