Understanding Williams %R:
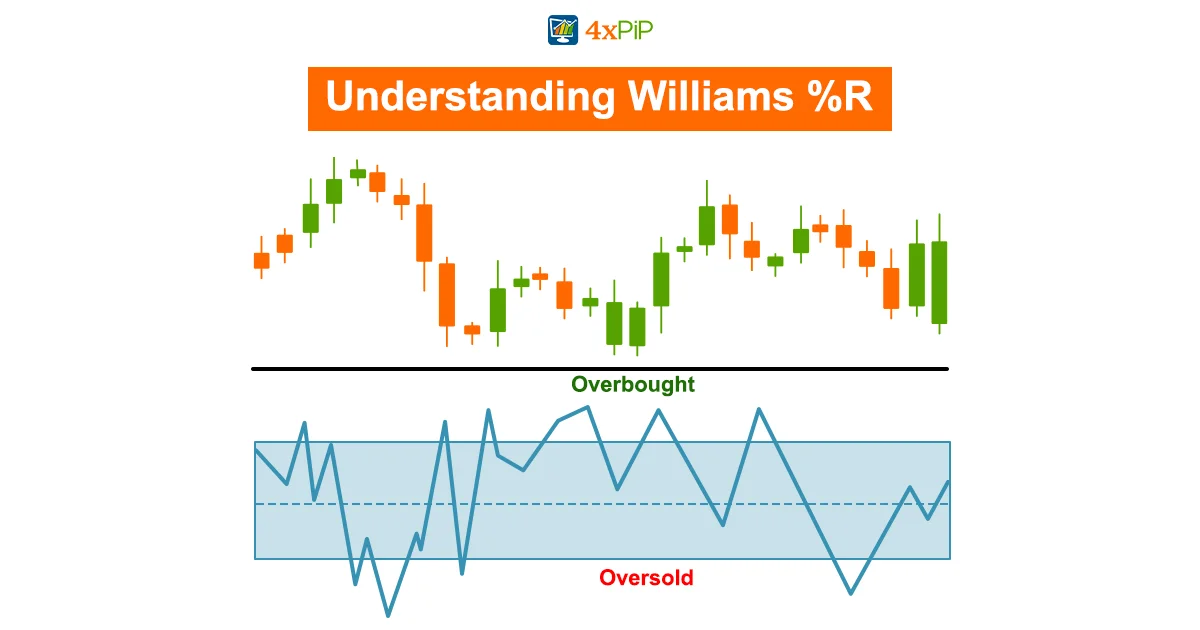
Williams %R, or the Williams Percent Range, operates on a scale from 0 to -100. It serves as a guide to identifying overbought conditions (above -20) and oversold conditions (below -80). While not a guaranteed reversal signal, it outfits traders to recognize potential entry and exit points, similar to the Stochastic oscillator.
Practical Application:
Decoding Williams %R Readings:
The indicator’s readings provide valuable clues. A range between -20 and 0 signals overbought conditions, suggesting the price is near recent highs. Conversely, readings between -80 and -100 indicate oversold conditions, implying the price is at the lower end of its recent range.
Strategies for Trading Success:
During an uptrend, alert traders should carefully track the Williams %R, particularly when it dips below -80. This occurrence signals a potential phase of consolidation or pullback in the price. As the price subsequently ascends and the indicator reverts above -80, it serves as a crucial indicator of a potential resumption of the uptrend. This strategic observation aligns with the idea that, in a strong upward market movement, temporary retracements or pauses are normal before the trend continues.
Spotting Momentum Failures:
Stay vigilant for signs of momentum failures within robust trends. In a strong uptrend, if the Williams %R struggles to reclaim levels above -20 after a decline, it signifies a potential weakening of upward momentum. Additionally, this scenario may serve as an early warning for traders, indicating the possibility of a substantial price decline soon. Monitoring such momentum failures is a proactive strategy that allows traders to adjust their positions or consider protective measures. Moreover, aligning their actions with the evolving dynamics of the market trend is crucial for making informed decisions.
Williams %R vs. Fast Stochastic Oscillator:
Understanding the nuances between William %R and the Fast Stochastic Oscillator holds significance. Additionally, while both tools evaluate market levels concerning highs and lows, William %R introduces a corrective factor by multiplying its readings by -100. Despite providing similar insights, the differentiation lies in this slight scaling adjustment. Traders utilizing these indicators should be mindful of this subtle yet crucial difference. Moreover, ensuring an accurate interpretation of market conditions and making informed decisions based on the specific scaling characteristics of each tool is essential.
Pros and Cons:
Pros:
- Provides clear signals for overbought and oversold conditions.
- Offers valuable insights into potential trend reversals.
- Dynamic calculation adapts to changing market conditions.
Cons:
- Overbought and oversold readings don’t guarantee reversals.
- Can be too responsive, leading to false signals in rapidly changing markets.
Conclusion:
Disclaimer: Trading involves risks, and it’s essential to conduct thorough research and seek professional advice.