Traders in every corner of the market, from seasoned to beginners, rely on technical analysis to analyze the ever-changing currents of price action. Among the many tools at their disposal, candlestick patterns hold a special place, offering visual cues to potential market trends. Today, with 4xPip, we’ll delve into the depths of one such pattern: the Inverted Hammer, a beacon of hope in downtrends and a potential indicator of bullish reversals. We prioritize the inclusion of Inverted Hammer Candlestick in your trading strategy. Embrace the insights the Inverted Hammer Candlestick provides and elevate your trading experience with 4xPip’s efficient bots.
What is an Inverted Hammer Candlestick Pattern in Trading?
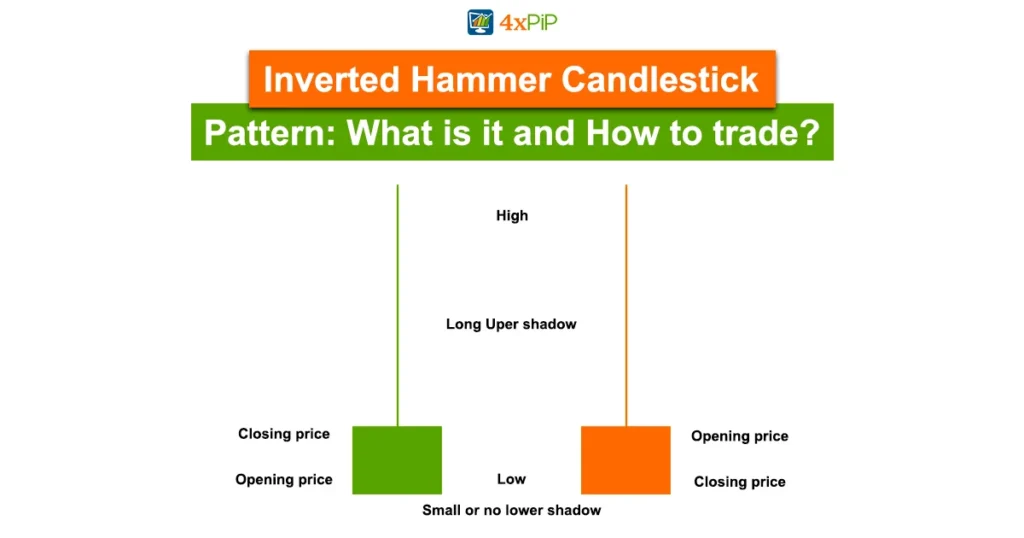
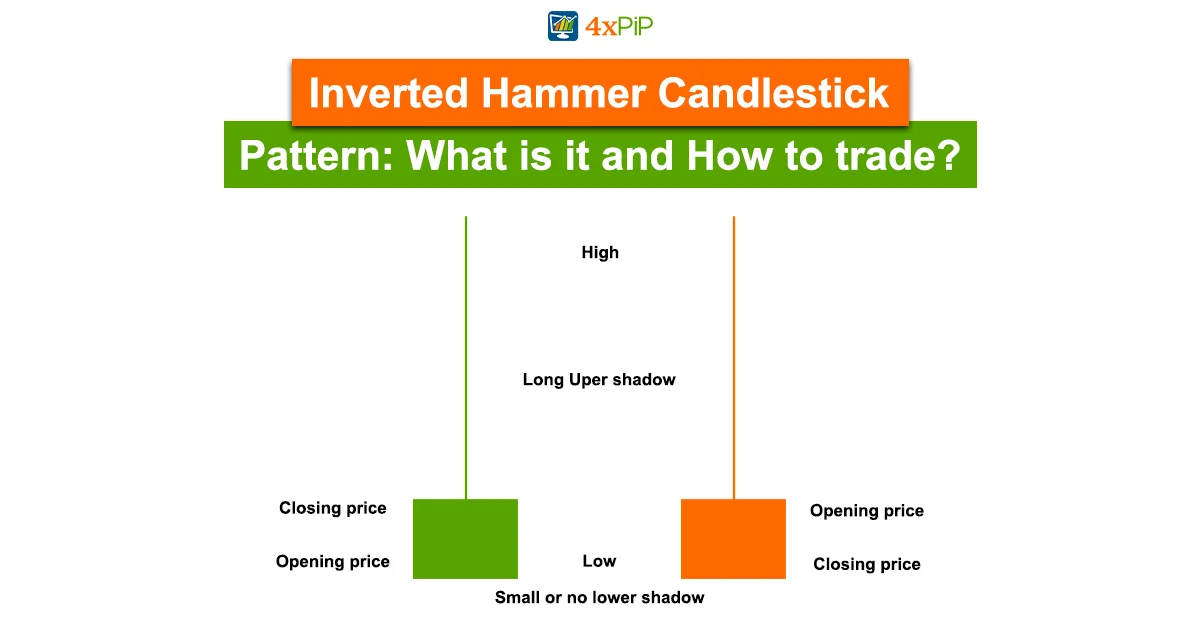
The Inverted Hammer is a single candlestick pattern that holds significant weight in technical analysis. It is characterized by a small body and a long upper shadow, which is at least twice the length of the body. The lower shadow of the candlestick is either non-existent or very small. Visually, the pattern resembles an inverted capital “T”, an upside-down hammer; it often appears at the end of a downtrend, signaling a potential bullish reversal.
The Inverted Hammer candlestick pattern, originating in 17th and 18th-century Japanese rice trading markets, was conceived by the influential trader Homma Munehisa. This pattern gained global recognition in the 19th century. Homma’s insights into the impact of market emotions on asset or security prices led to the development of visual representations using candlesticks, illustrating the relationships between opening, closing, high, and low prices. The Inverted Hammer Pattern itself signifies a struggle between buyers and sellers, highlighting the resilience of buyers in driving prices higher despite initial selling pressure. Notably, the formation of this pattern is accompanied by a significant increase in trading volume, underscoring its importance in identifying potential trend reversals.
What is the Formation of the Inverted Hammer Candlestick?
The formation of the Inverted Hammer candlestick is a result of a battle between buyers and sellers. During a downtrend, sellers dominate the market, pushing the price lower. However, as the price approaches a support level, buyers start to step in, causing the price to bounce back. This buying pressure is reflected in the long upper shadow of the candlestick. The small body represents the opening and closing prices, which are typically close to each other. To fully grasp the power of the Inverted Hammer, let’s break down its formation:
- A small real body: This represents the difference between the opening and closing prices, and in the case of the Inverted Hammer, it’s relatively small compared to the overall candle size.
- A long upper shadow: This wick extends significantly above the real body, indicating strong selling pressure that was ultimately overcome by buying forces.
- Little to no lower shadow: Ideally, the lower shadow is either non-existent or very tiny, suggesting limited downside movement during the trading period.
The Inverted Hammer candlestick pattern provides several key indicators that can help traders anticipate market movements. Firstly, it signals a potential trend reversal, especially when it forms at the bottom of a downtrend. This suggests that the selling pressure is weakening, and buyers are starting to take control. Secondly, the long upper shadow indicates that buyers were able to push the price higher during the trading session. This shows that there is buying interest in the market. Lastly, the small body of the candlestick suggests indecision between buyers and sellers, which often precedes a shift in market direction.
What Does an Inverted Green and Red Hammer Candle Indicate?
In traditional candlestick charting, the color of the candlestick provides additional information about market sentiment. In case of Inverted Hammer, the color of body is not as significant as overall shape of the candlestick. However, some traders prefer to use colored candlesticks to differentiate between bullish and bearish Inverted Hammers. A green Inverted Hammer indicates a potential bullish reversal, while a red Inverted Hammer suggests a bearish reversal. The color of the real body doesn’t fundamentally change the pattern’s meaning, but it can offer additional insights:
Red Inverted Hammer candle: This occurs during downtrends and suggests a potential bullish reversal. The buying pressure hinted at by the long upper shadow might signal a shift in market trends.
Green Inverted Hammer candle: This forms within uptrends and can indicate temporary pullbacks followed by continued upward momentum.
How to Trade with an Inverted Hammer Candlestick Pattern in Forex?
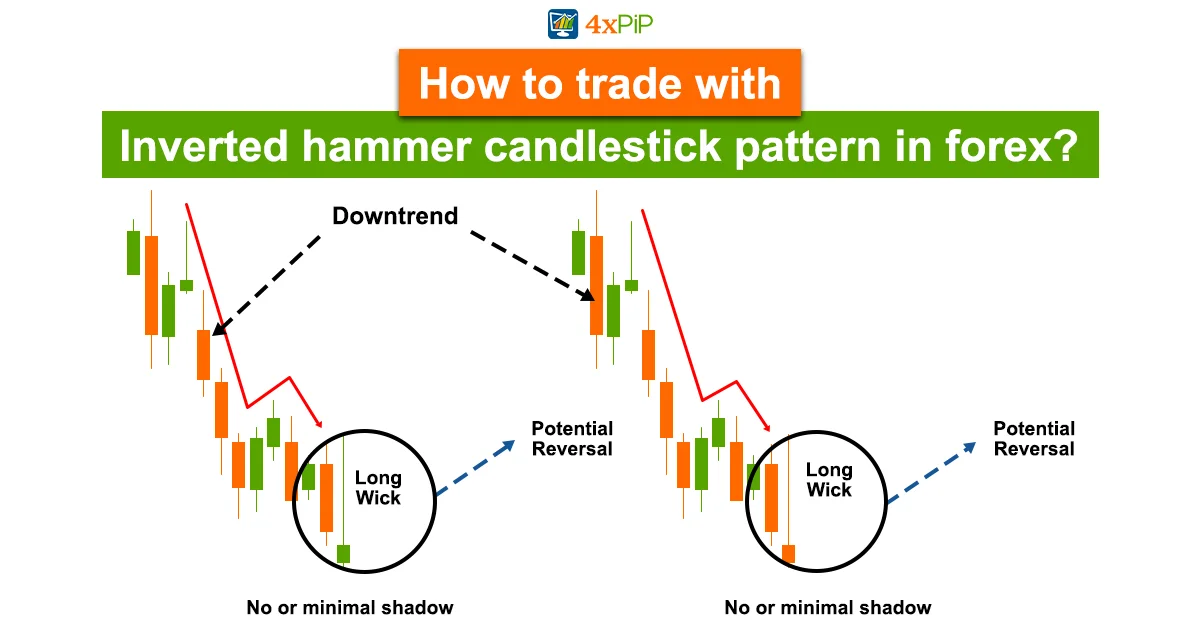
The beauty of technical analysis lies in its universal applicability. The Inverted Hammer can be just as effective in forex trading as it is in other markets. Trading with the Inverted Hammer candlestick pattern in the forex market requires a thorough understanding of its implications and careful analysis of other technical indicators like trendlines break, RSI and MACD. Once the pattern is identified, traders can look for confirmation signals to enter a position. This can be done by waiting for a bullish candlestick to form after the Inverted Hammer, indicating a potential upward move. While the Inverted Hammer offers valuable insights, here are some tips for incorporating it into your trading strategy:
Confirmation is Key:
Don’t base your entire trading decision solely on the Inverted Hammer. Look for additional confirmation signals like bullish engulfing patterns, moving average crossovers, or RSI divergence.
Timing is Crucial:
Ideally, wait for the bullish candle to follow Inverted Hammer before entering long or buy position. This reinforces the reversal signal and reduces the risk of false breakouts.
Manage Your Risk:
Place stop-loss orders below the low of the Inverted Hammer to limit potential losses if the reversal doesn’t materialize.
Adjust for Different Timeframes:
The Inverted Hammer’s significance can vary depending on the timeframe you’re analyzing. On shorter timeframes, it might indicate a minor pullback. On longer timeframes, it could signal a more substantial trend change.
Focus on Major Currency Pairs:
Due to their higher liquidity, major pairs like EUR/USD and GBP/USD offer more reliable Inverted Hammer signals compared to less liquid pairs.
Combined with Fundamental Analysis:
Forex markets are heavily influenced by economic news and events. Consider the fundamental backdrop before making trading decisions based on the Inverted Hammer.
4xPip specializes in developing Indicators and Expert Advisors (EAs) compatible with MetaTrader 4 and MetaTrader 5 for diverse financial markets, including forex, cryptocurrency, commodities, stocks, and indices. Our automated trading solutions leverage advanced algorithms to make intelligent decisions, incorporating thorough analyses of candlestick patterns, price charts, and market trends. Our EA excels in precisely timing trade openings and optimizing profit potential, ensuring efficient and strategic automated Trading for our clients. Connect with our experts and discover our range of products to make well-informed trading decisions.
What is the Difference Between a Shooting Star and an Inverted Hammer?
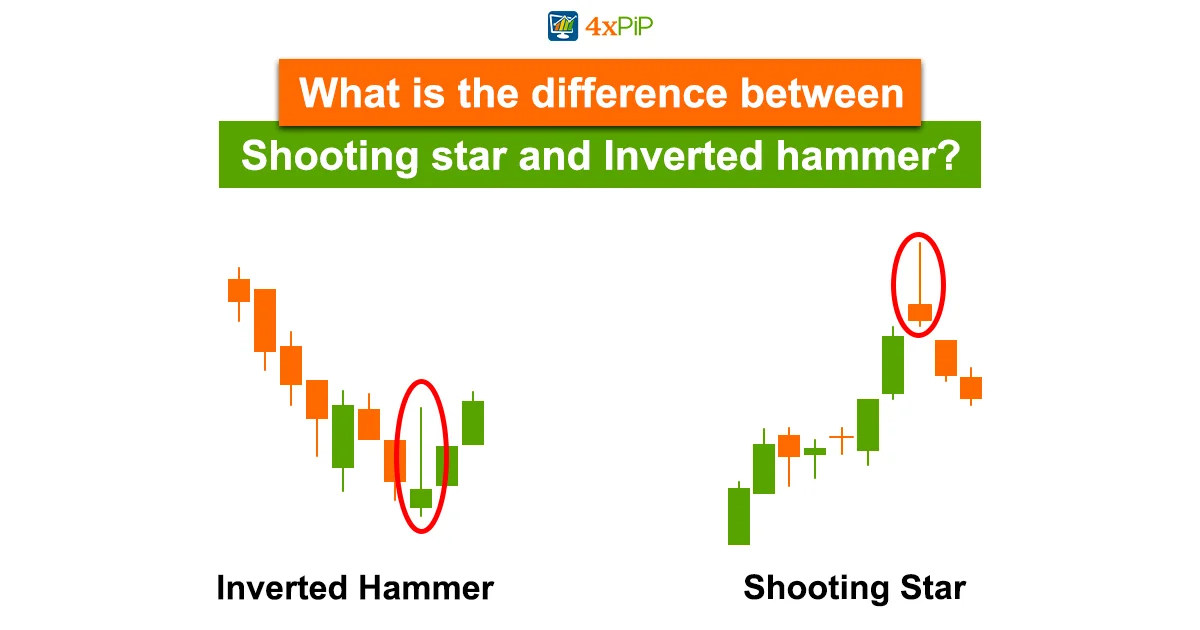
The Inverted Hammer and Shooting Star candlestick patterns share similar characteristics, which can make them confusing for traders. Both patterns have small bodies and long upper shadows. However, the key difference lies in their formation and context within the market. The Inverted Hammer forms at the bottom of a downtrend and signals a potential trend reversal, while the Shooting Star forms at the top of an uptrend and indicates a potential bearish reversal. Traders need to pay attention to the overall market context to differentiate between the two patterns accurately.
Here are some crucial differences between shooting star and inverted hammer candlestick
Upper Shadow Length: The Inverted Hammer’s upper shadow is at least twice the real body length, while the Shooting Star’s is generally shorter.
Real Body Position: The Inverted Hammer’s real body is located in the lower half of the candle, while the Shooting Star’s real body is closer to the middle or top.
Trend Context: The Inverted Hammer appears at downtrend bottoms, hinting at bullish reversals, while the Shooting Star forms at uptrend tops, suggesting potential bearish continuations.
Conclusion:
The Inverted Hammer candlestick pattern is a powerful tool that can enhance a trader’s ability to identify trend reversals and potential buying opportunities. By understanding the formation, interpretation, and trading strategies associated with this pattern, traders can gain a competitive edge in the market. For those seeking efficient and reliable indicators and expert advisors, 4xPip offers a range of free tools that can aid in market analysis and generate accurate buy and sell signals, empowering traders to make informed decisions in their financial efforts.
For additional information on indicators, feel free to contact us via email at [email protected]. Our dedicated team is here to support your journey to success.