In financial trading, having robust tools and indicators can make all the difference between success and uncertainty. One such powerful tool gaining popularity among traders is the Ichimoku Cloud indicator. The Ichimoku Cloud is renowned for its simplicity and efficiency in providing a holistic market overview. In this article, we’ll delve into the essence of the Ichimoku Cloud, exploring its formula, components, and functionality and focusing on how it contributes to informed decision-making in financial markets. At 4xPip, we prioritize the inclusion of these indicators in your trading strategy. Connect with our experts and discover our range of products to make well-informed trading decisions. For additional information on indicators, feel free to contact us via email at [email protected]. Our dedicated team is here to support your journey to success.
What is the Ichimoku Cloud Indicator?
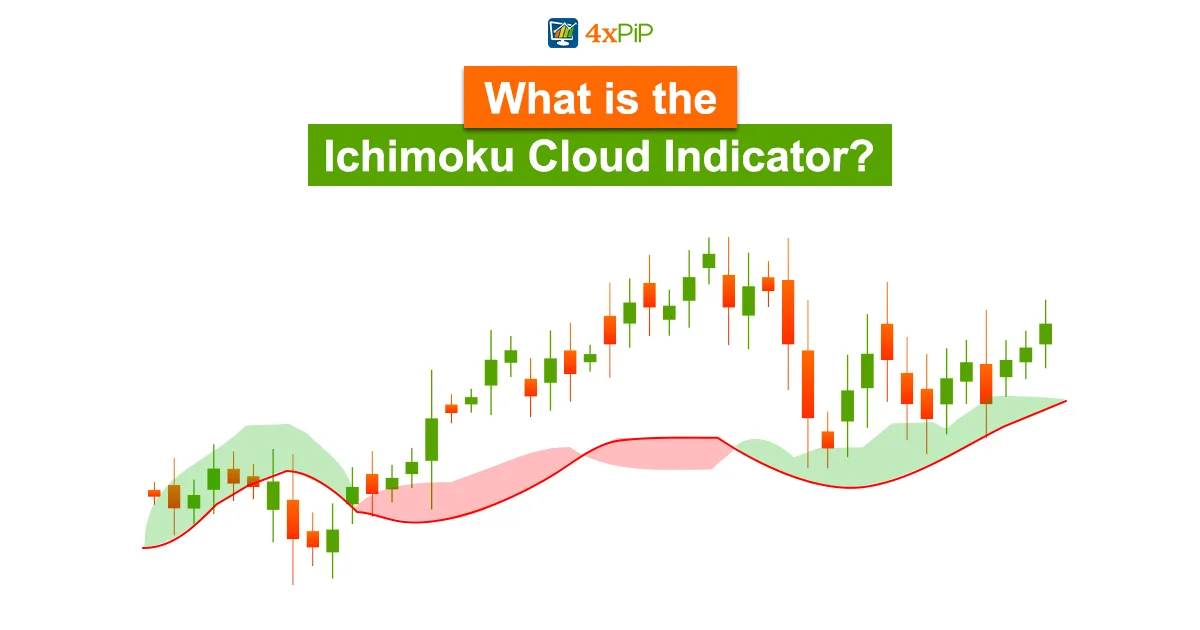
The Ichimoku Cloud, also known as Ichimoku Kinko Hyo, is a Japanese charting technique designed to offer a holistic perspective on market trends. Developed by Japanese journalist Goichi Hosoda in the late 1960s, it translates to “one glance equilibrium chart” in English. Furthermore, renowned for providing a clear and immediate snapshot of market conditions, traders often find it valuable for identifying trend direction, momentum, and potential entry and exit points.
Transitioning to the technical aspects, the Ichimoku Cloud encompasses a set of indicators designed to reveal support and resistance levels, along with momentum and trend direction. This is achieved by calculating various averages and graphing them on a chart. Additionally, the Ichimoku Cloud utilizes these calculations to generate a “cloud” predicting potential future support or resistance zones for the price. It offers a more significant number of data points compared to the traditional candlestick chart.
While it may appear intricate initially, individuals versed in chart analysis often discover that it becomes easily understandable, providing clearly defined trading signals. Traders commonly use the Ichimoku lines and cloud to place long or short trades.
Formula and Components of Ichimoku Cloud:
The Ichimoku Cloud comprises several elements, each contributing to its effectiveness in analyzing market dynamics and calculating using specific formulas. Here are the formulas and key elements of the Ichimoku Cloud:
-
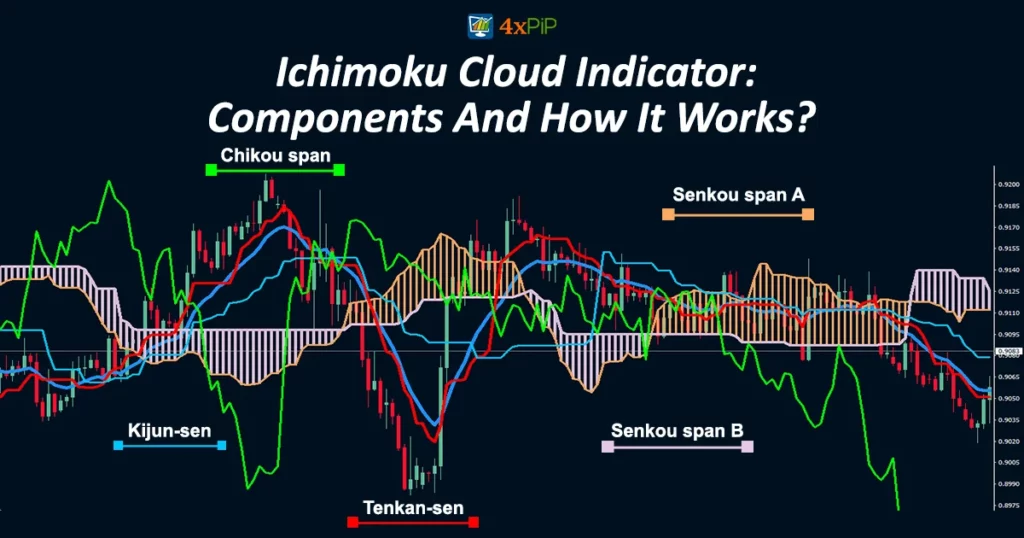
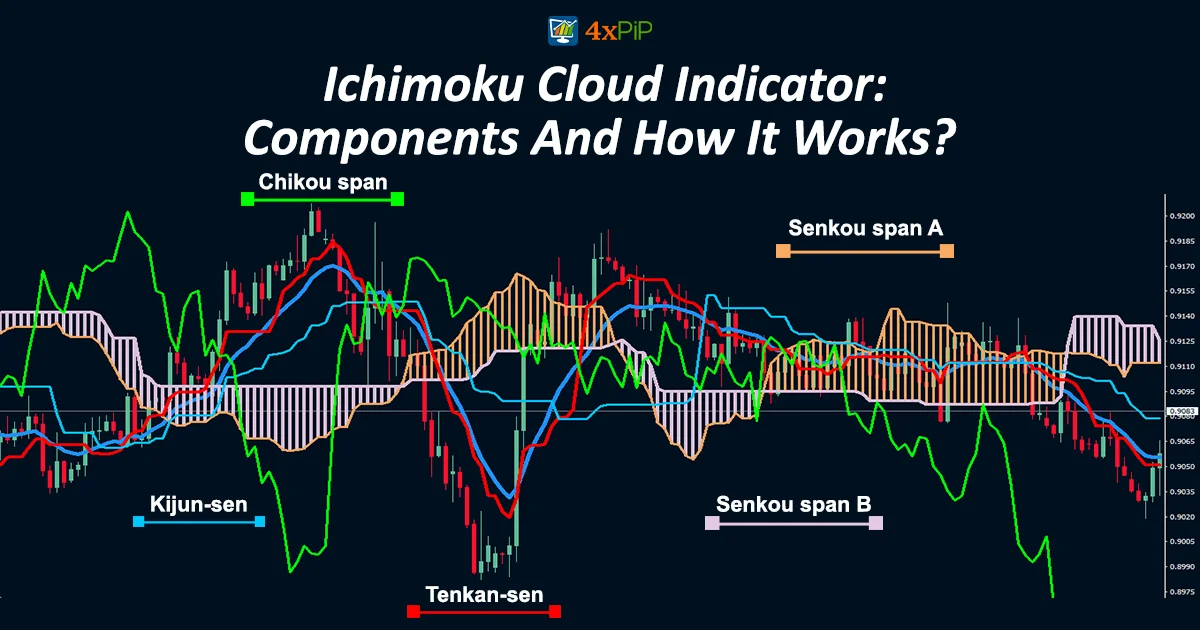
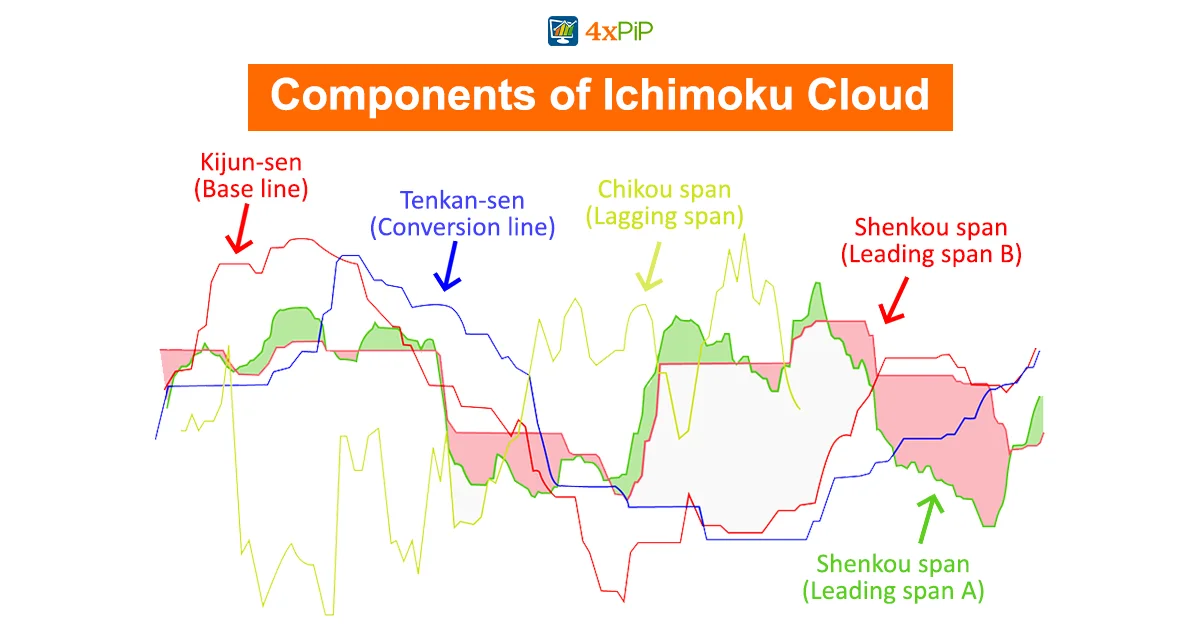
Tenkan-Sen (Conversion Line):
The initial element of the Ichimoku Cloud is the Tenkan-Sen, typically depicted as a red line on the chart. This is the faster-moving average and is calculated as the average of the highest high and lowest low over a specific period, often nine periods.
Formula = (Highest High + Lowest Low) / 2 over a specific period (typically 9 periods).
-
Kijun-Sen (Base Line):
The Kijun-Sen is a support/resistance line, providing insights into future price movements. It is commonly depicted as a blue line. The slower-moving average calculated similarly to the Tenkan-Sen but over a longer period, typically 26 periods.
Formula = (Highest High + Lowest Low) / 2 over a longer period (usually 26 periods).
-
Senkou Span A (Leading Span A):
The Senkou Span is calculated as the average of the highs and lows of Tenkan-Sen and Kijun-Sen, then plotted 26 periods to the right. An orange line on the chart visually denotes the Senkou Span A. Should the security price surpass Senkou Span A (orange line), the upper and lower lines transform into the first and second support levels. Conversely, if the price descends below the Senkou Span A, the lower and upper lines become the first and second resistance levels, respectively.
This component represents the midpoint between the Tenkan-Sen and Kijun-Sen, projected forward by the same number of periods as the Kijun-Sen.
Formula = (Tenkan Sen + Kijun Sen) / 2, plotted 26 periods ahead.
-
Senkou Span B (Leading Span B):
Calculated as the highest high and lowest low average over the past 52 periods, projected forward by the same number of periods as the Kijun-Sen.
Formula = (Highest High + Lowest Low) / 2 over an extended period (typically 52 periods), plotted 26 periods ahead.
-
Kumo (Cloud):
The shaded area between Senkou Span A and Senkou Span B. Its colour changes based on the relative position of Span A and Span B, providing visual cues about the trend direction.
Also, understanding these formulas allows traders to interpret the Ichimoku Cloud’s components and make informed decisions based on the signals generated by this comprehensive technical analysis tool. As you embark on your trading journey, consider the expertise of 4xPip as a valuable ally in unlocking the full potential of the Ichimoku Cloud.
How Ichimoku Cloud Indicator Works?
The highest and lowest prices observed during a specific period, such as the last nine days for the conversion line, constitute the highs and lows. While incorporating the Ichimoku Cloud indicator automates these calculations on your chart, manual analysis involves the following steps:
- Calculate both the Conversion Line and the Base Line.
- Compute Leading Span A based on the preceding calculations and plot this data point 26 periods into the future.
- Calculate Leading Span B and plot this data point 26 periods into the future.
- For the Lagging Span, plot the closing price 26 periods into the past on the chart.
- The disparity between Leading Span A and Leading Span B is shaded, forming the cloud.
- Suppose Leading Span A is positioned above Leading Span B, colour the cloud green. Suppose Leading Span A is below Leading Span B, colour the cloud red.
These steps generate one data point. To construct the lines, repeat the process as each period concludes, generating new data points. Connect these data points to create the lines and the cloud’s visual representation. Including the Ichimoku Cloud indicator on your chart automates the necessary calculations for you. Contact [email protected] now to get your indicator and make your life easier.
Ichimoku Cloud Signals And Trading Strategy:
Traders can interpret the indicator in the following ways:
- Trend Identification: When the price is above the cloud, it indicates an uptrend, while a price below the cloud suggests a downtrend.
- Candle breakouts: When the candle breaks the Ichimoku cloud and goes in the upward direction indicates Uptrend and if candles breaks the Ichimoku cloud in the downward direction, indicates a downtrend.
- Momentum Analysis: The angle and separation of the Tenkan-Sen and Kijun-Sen lines provide insights into the strength of the prevailing trend.
- Reversal Signals: The crossover of the Tenkan-Sen and Kijun-Sen lines can signal potential trend reversals.
- Cloud Confirmation: Changes in the Kumo (cloud) colour can confirm the prevailing trend direction. An upward trend is reinforced when Senkou Span A is above Senkou Span B and vice versa.
What Is The Ichimoku Cloud Strategy For Crypto?
The Ichimoku Cloud indicator is a widely adopted and highly impactful technical tool in cryptocurrency trading. It provides valuable insights into the market’s bullish or bearish conditions, potential levels of support or resistance, and indications of potential shifts in the prevailing trend.
Hence, numerous cryptocurrency traders opt for (10, 30, and 60) instead of the original settings to align with the continuous 24/7 operation of crypto markets. There is ongoing speculation about the effectiveness of this adjustment in adapting the system.
What Are The Limitations Of The Ichimoku Cloud Indicator?
The limitation is its reliance on historical data, needing more inherent predictiveness despite plotting some points in the future. The cloud may lose relevance during extended periods when prices significantly deviate from it, emphasizing the significance of the conversion line, the baseline, and their crossovers during such times.