Predicting stock prices accurately is a coveted skill in financial markets. Traders and investors always seek reliable tools and strategies to give them an edge. One such aid that has stood the test of time is the Bullish Candlestick Chart. This comprehensive guide will delve into the art of predicting stock prices using Bullish Candlestick Charts. We will focus on the innovative solutions provided by 4xPip, a leading store for automated trading on the MT4 and MT5 platforms.
What is a Bullish Candlestick Chart Pattern?
Candlestick charts are widely used in technical analysis to visualize price movements and patterns. Bullish Candlestick Charts, in particular, are instrumental in identifying potential upward trends in stock prices. Also, bullish candlesticks signal opportune moments for initiating long or buy trades and can aid in anticipating a reversal from a downtrend to an upward movement. These charts consist of individual “candles” representing a specific period. Moreover, each candle comprises four main components: the open, close, high, and low prices for that period.
How to Analyze Candlesticks in Trading?
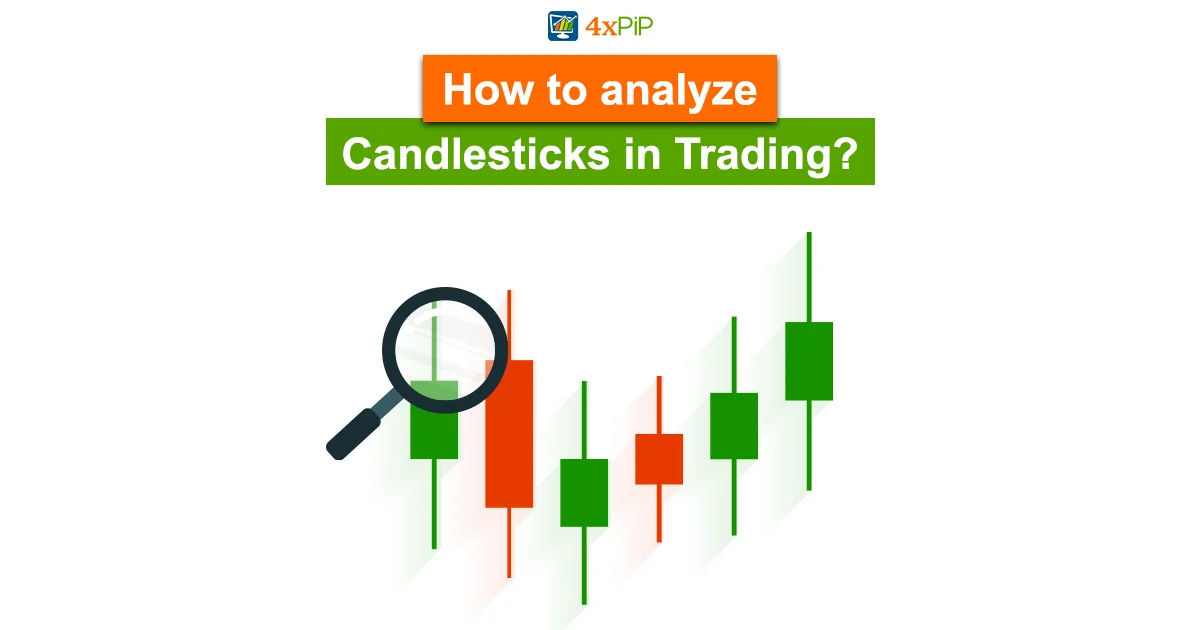
The term “candlesticks” is derived from their resemblance to candles, featuring a rectangular shape with lines extending from either end, mimicking the wicks of a candle. Each candlestick on a chart represents a specific trading period, usually a day. Moreover, the “body” of the candle shows the open and close prices: a hollow body for a rising price (bullish) and a filled body for a falling price (bearish). The shadows, or wicks, extending above and below the body, depict the highest and lowest traded prices within that period. As time passes, the candlesticks form distinctive patterns that investors and traders can utilize to inform their decisions regarding buying and selling. Also, 4xpip offers solutions for automated trading on the MT4 and MT5 platforms. Our Expert Advisor (EA) and Indicators are designed to leverage the power of technical analysis, candlestick patterns, and market trends to make intelligent trading decisions.
Types of Bullish Candlestick Patterns:
Bullish candlestick patterns are formations that suggest a potential upward movement in the price of a financial instrument. For one to four weeks, patterns take shape and provide valuable insights into a stock’s potential future price movements. Also, these patterns are commonly used in technical analysis to assist traders and investors in making decisions. Moreover, here are some of the well-known bullish candlestick patterns:
Bullish Engulfing Candlestick Pattern:
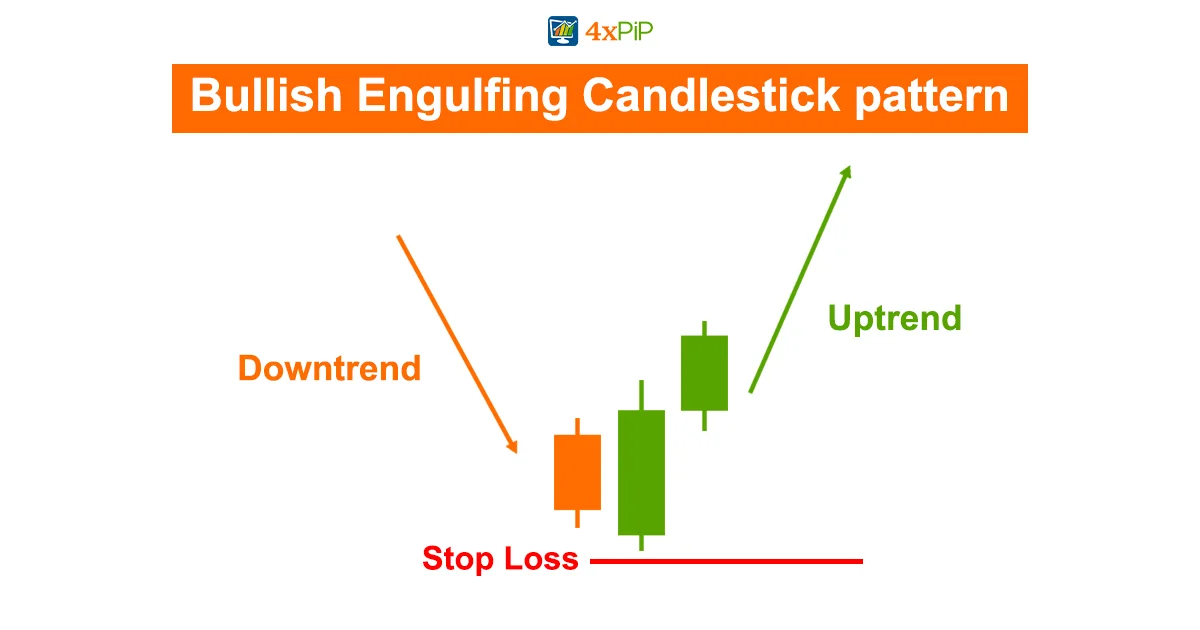
- A two-candle pattern where the first candle has a small real body (red or bearish), and the second candle has a larger real body (green or bullish) that completely engulfs the first candle.
- This pattern strongly signals that the bulls have taken control and that the price will likely increase.
Piercing Candlestick Pattern:
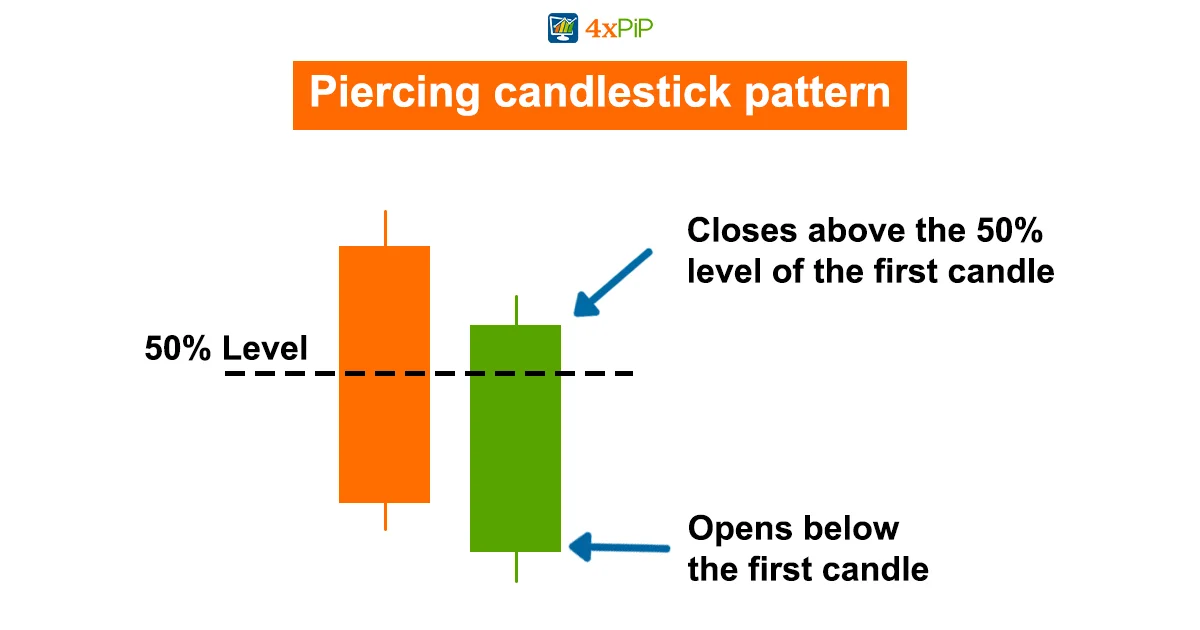
- This pattern occurs after a downtrend and consists of a long red (bearish) candle followed by a green (bullish) candle that opens below the low of the first candle but closes more than halfway into its body.
- This pattern is similar to the engulfing pattern.
Morning Star Candlestick Pattern:
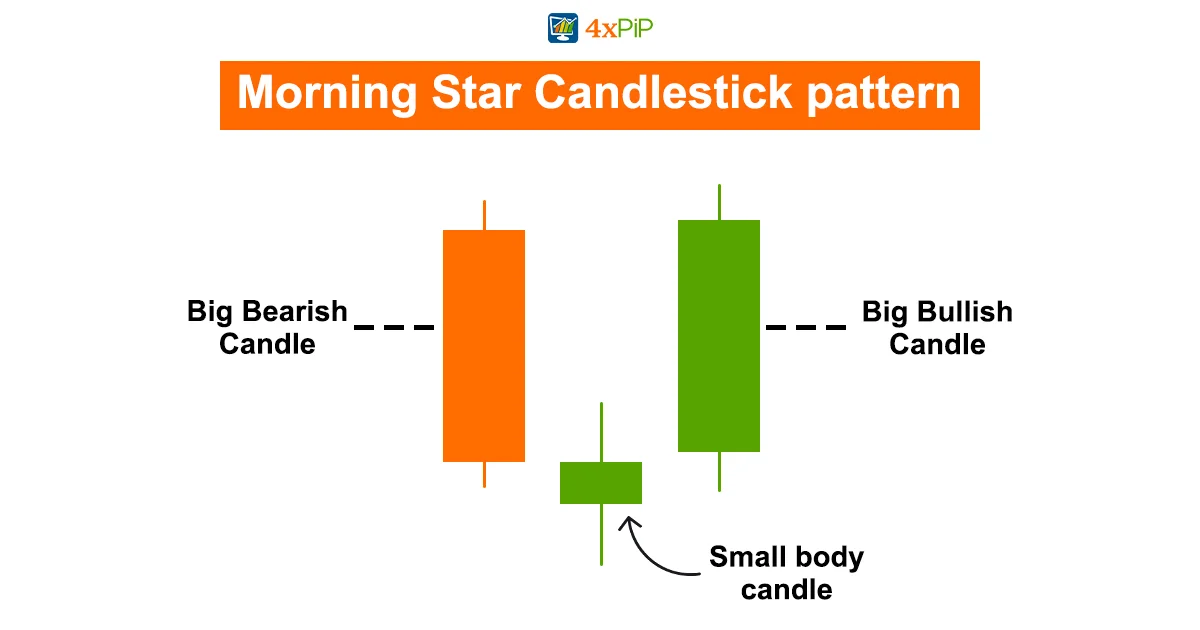
- A three-candle pattern consisting of a long red (bearish) candle, followed by a small-bodied candle, and then a long green (bullish) candle.
- Signals a potential reversal from a downtrend. The first candle indicates selling pressure, the second shows indecision, and the third confirms bullish strength.
- This pattern suggests that the bears were in control at the beginning of the downtrend, but the bulls gradually gained strength and reversed the trend.
Morning Doji Star Candlestick Pattern:
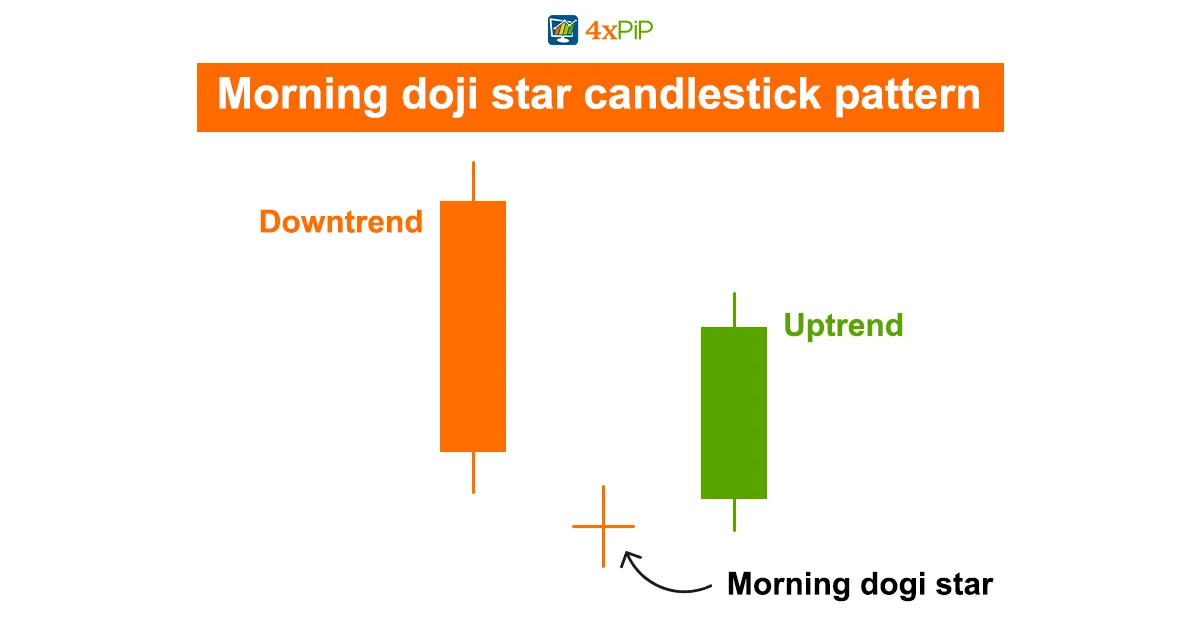
- The pattern begins with a long red (bearish) candle, indicating a prevailing downtrend in the market.
- The second candle is a Doji, characterized by a small body with upper and lower shadows. The opening and closing prices are virtually the same, reflecting market indecision.
- The third candle is a long green (bullish) candle that closes above the midpoint of the first candle. This candle signifies a shift in sentiment from bearish to bullish.
- Lastly, the strength of the reversal signal is enhanced if the third candle is accompanied by increased trading volume.
Hammer Or The Inverted Hammer Candlestick Pattern: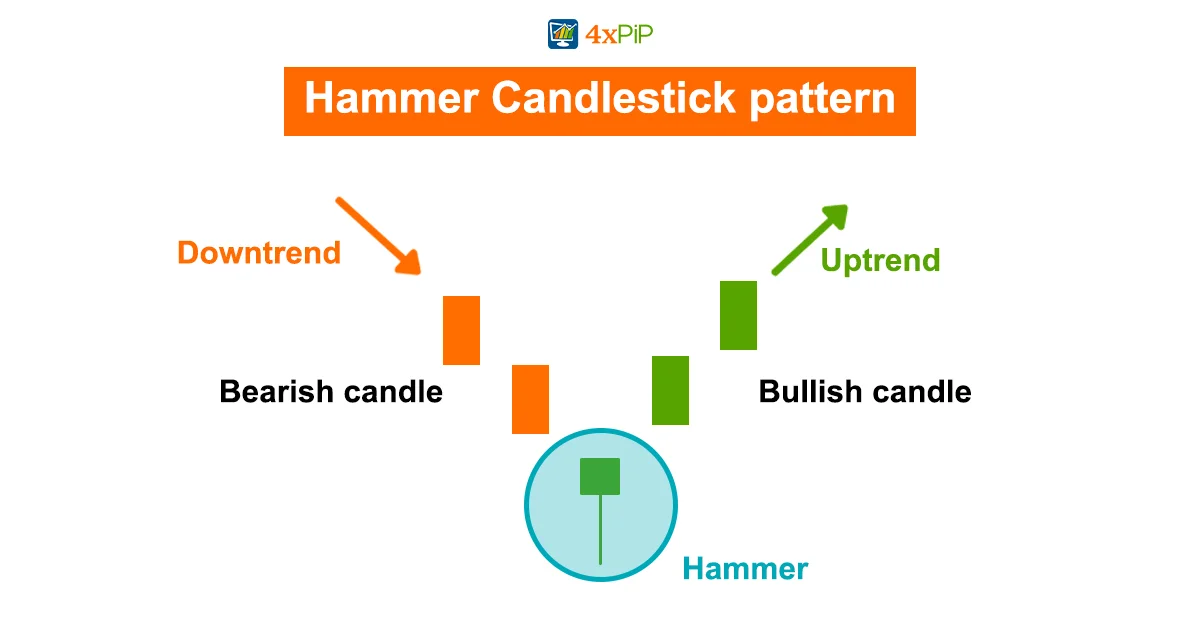
- A single candlestick with a small body near the top and a long lower shadow resembling a hammer.
- Indicates potential reversal after a downtrend. The long lower shadow suggests that sellers drove prices lower during the session but ultimately failed to maintain control.
- Inverted hammer Candlestick Similar to a hammer but appears at the bottom of a downtrend. It has a small body near the top and a long upper shadow.
- Implies potential reversal. The long upper shadow indicates that buyers stepped in and overcame selling pressure.
Moreover, we examined five well-known candlestick chart patterns that indicate opportunities for buying. Lastly, these patterns assist in recognizing shifts in trader sentiment, wherein buyer pressure surpasses seller pressure. Furthermore, such reversals in a downtrend may present an opportunity for significant long-term gains.
Predict Stock Price Using Bullish Candlestick Charts:
Bullish reversal patterns are expected to emerge within a downtrend; otherwise, they do not indicate a bullish pattern but signify a continuation pattern. For the majority of bullish reversal patterns, bullish confirmation is essential. Moreover, an upward price movement, often represented by a long hollow candlestick or a gap up, needs to succeed them, accompanied by significant trading volume. Investors must further validate the reversal through subsequent price action before committing to a trade, even though this confirmation signal is expected within three days of the pattern’s formation. Furthermore, with 4xpip’s advanced Expert Advisor and Indicators, traders gain a significant advantage in analyzing the complex world of financial markets. Lastly, by incorporating Bullish Candlestick Patterns into their analysis, traders can make more informed decisions, increasing the likelihood of success in the dynamic and growing landscape of stock trading.
Conclusion:
Predicting stock prices is an art, not a science. By mastering the language of bullish candlestick patterns and harnessing the power of tools like those offered by 4xpip, you can transform from a passive observer to an active participant in the market’s trend. Also, remember, knowledge is your compass, discipline your rudder, and a well-trained eye your sail. Further, set course, embrace the bulls, and confidently analyze the market!
Furthermore, join the 4xpip community and unlock the secrets of the market! Lastly, visit our website, 4xPip, or follow us on social media for insightful trading tips, market updates, and access to our powerful trading tools.