In the world of technical analysis, two widely used indicators for tracking price trends over time are the Simple Moving Average (SMA) and the Exponential Moving Average (EMA). These indicators provide valuable insights into market trends and are often used by traders and investors to make informed decisions. In this comprehensive guide, we’ll explore formulas and calculations behind SMA and EMA and discuss their applications in financial markets. Lastly, this hands-on approach will equip you with the confidence to wield the EMA as a powerful weapon in your Forex trading journey on 4xPip!
Introducing Simple Moving Average (SMA) and Exponential Moving Average (EMA):
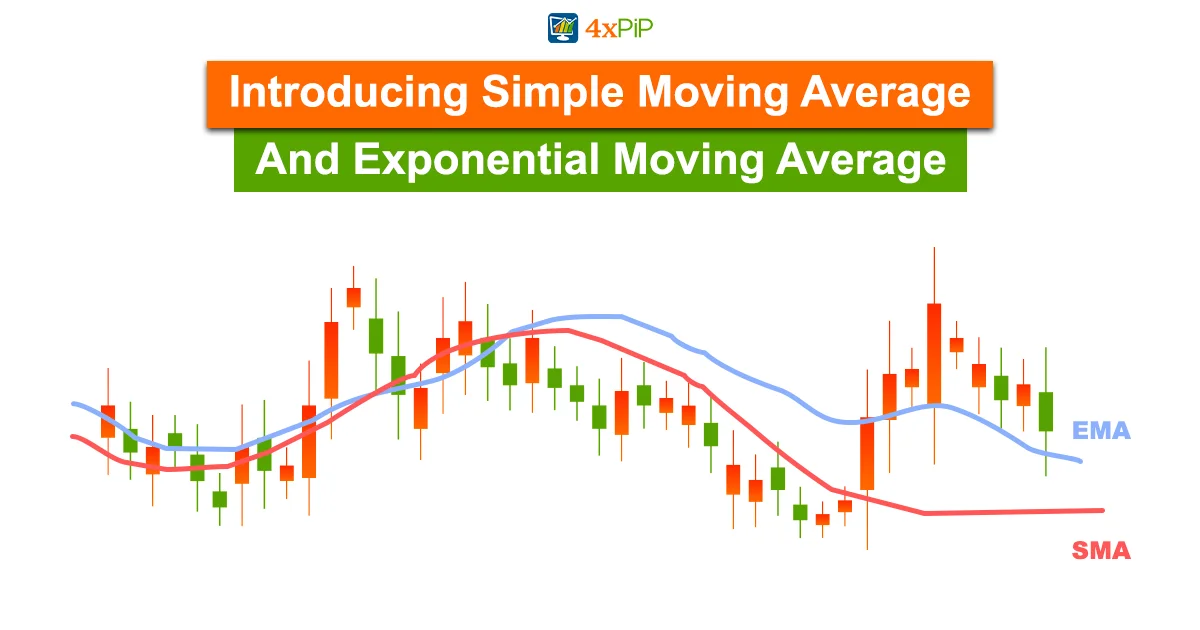
The Simple Moving Average (SMA) is a fundamental computation that yields an average price value across a defined period. It serves as a widely employed indicator for recognizing trends and establishing support and resistance levels. The SMA is computed by adding the closing prices of an asset or security over a specified number of periods and subsequently dividing the sum by the number of periods.
While the SMA offers a straightforward average of price data during a designated time frame, the Exponential Moving Average (EMA) employs a distinct approach. The EMA assigns greater weight or significance to recent price data, deeming it more pertinent than older data. Also, this weighted approach enables the EMA to react more promptly to price fluctuations when compared to the SMA.
Formula and Calculation of Simple Moving Average (SMA):
The formula for calculating the SMA is as follows:
SMA = (A₁ + A₂ + … + An) / n
In this formula, SMA represents the Simple Moving Average, A₁ to An represents the closing prices of the asset or security for each period, and n represents the number of total periods.
Let’s take an example to understand the calculation of the SMA better. Suppose we want to calculate the 20-day SMA of a stock. We would sum up the closing prices of the stock for the past 20 days and divide the sum by 20. This would give us the average price over the 10-day period, which can help us identify trends and potential support and resistance levels.
Formula and Calculation of Exponential Moving Average (EMA):
The formula for calculating the EMA involves three steps:
Compute the SMA:
Just like with the SMA calculation, the EMA calculation starts with computing the SMA over a specific number of periods.
Calculate the multiplier for weighting the EMA:
The next step is to calculate the multiplier, which determines the weighting given to the most recent price data. The formula for the multiplier is as follows:
Weighted multiplier = 2 / (selected time period + 1)
For example, if we are calculating a 20-day EMA, the weighted multiplier would be 2/(20+1)=0.0952 or 9.52%.
Calculate the current EMA:
Finally, we calculate the current EMA by applying the multiplier to the most recent price data and adding it to the previous EMA multiplied by (1 – weighted multiplier). The formula for calculating the current EMA is as follows:
EMA = Price(t) × k + EMA(y) × (1 – k)
In this formula, EMA represents the Exponential Moving Average, Price(t) represents the current price, EMA(y) represents the previous EMA, N represents the number of days in the EMA, and k represents the weighted multiplier.
The EMA calculation gives more weight to recent price data, leading to a faster response to price changes and a smoother line compared to the SMA. Traders often use the EMA to identify trends, generate buy or sell signals, and determine support and resistance levels.
What is The Ribbon Setting for The Moving Average?
The Exponential Moving Average (EMA) ribbon is a technical analysis tool used in financial markets, including forex trading. It involves plotting multiple exponential moving averages with different periods simultaneously on a price chart.
Traders frequently employ a moving average ribbon, often configured with 10-period intervals, such as 10, 20, 30, 40, 50, and 60-period moving averages. It’s essential to note that the interval can vary and is not confined to 10 periods; traders may opt for intervals like five or 15 periods, among others, based on their specific preferences and analytical requirements.
To create a moving average ribbon, overlay numerous moving averages with varying periods on a price chart simultaneously. Commonly used parameters involve employing eight or more moving averages with intervals spanning from a two-day moving average to a 200- or 400-day moving average. For analytical simplicity, it is advisable to maintain consistency in the moving average throughout the ribbon, whether opting for exponential moving averages or simple moving averages exclusively.
What is Ribbon Fold in EMA?
A convergence of the moving averages into a single point on the chart, known as a ribbon fold, signals a potential weakening in trend strength, possibly indicating an impending reversal. Conversely, a divergence or fanning out of the moving averages suggests a strengthening trend, especially when they move apart from each other. Also, downtrends are often identified by shorter moving averages crossing below longer ones, while uptrends are characterized by shorter moving averages crossing above longer ones. Moreover, these instances showcase the predictive nature of short-term moving averages, confirmed as longer-term averages align with their trend direction.
How to Trade with Exponential Moving Average (EMA) Ribbon?
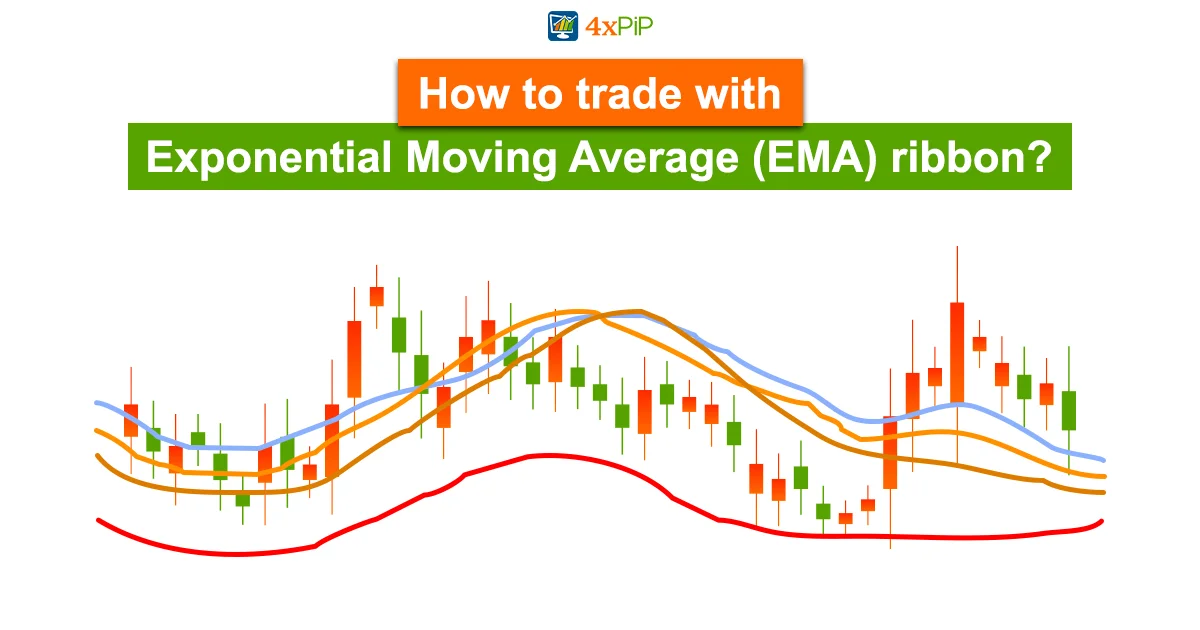
In forex trading, utilizing the power of the Exponential Moving Average (EMA) ribbon involves employing a series of EMAs with varying periods to create a dynamic visual representation of price trends. Traders utilize this EMA ribbon as a tool for trend identification and momentum assessment. The ribbon’s distinct layers, formed by EMAs with different responsiveness, enable traders to discern the strength and direction of the prevailing trends.
When EMAs align cohesively and fan out in a bullish formation, it signals an upward trend, prompting traders to consider long/buy positions. Conversely, a bearish trend is indicated when the EMAs form a descending ribbon. The EMA ribbon’s responsiveness to recent price action provides traders with a nuanced perspective on market dynamics, facilitating timely decision-making and enhancing the overall effectiveness of forex trading strategies.
How to Automate the Exponential Moving Average (EMA) Crossover Indicator?
EMA crossover indicator is widely used in technical analysis that involves comparing two Exponential Moving Averages (EMAs) with different periods. Typically, a short-term EMA, which gives more weight to recent prices, is compared with a long-term EMA that provides a smoother representation of the overall trend. A bullish crossover occurs when the short-term EMA crosses above the long-term EMA, signaling a potential shift from a downtrend to an uptrend. Conversely, bearish crossover happens when short-term EMA crosses below long-term EMA, indicating a possible change from an uptrend to a downtrend. Traders often use these crossovers as signals for entry/exit points in trades, interpreting them as indicators of changing market momentum.
4xPip MT4 EA Moving Average Crossover stands as an influential EA aimed at enhancing your trading efficiency and optimizing profits. This EA systematically executes trades based on precise crossover signals. Offering customizable parameters, traders have the flexibility to fine-tune settings, allowing them to discover optimal combinations for their trading preferences. Elevate your trading strategies and elevate your trading results by incorporating the MT4 Moving Average Crossover EA. Seize the opportunity to invest in this dependable trading bot today and unleash the full potential of your trading potential with 4xPip.
Conclusion:
In conclusion, mastering the Exponential Moving Average (EMA) and its counterparts, such as the Simple Moving Average (SMA), is pivotal for forex traders analyzing the complexities of technical analysis. Moreover, the EMA’s unique weighted formula ensures a swift response to recent price changes, distinguishing it from the SMA. Furthermore, extending the discussion to the EMA ribbon and its settings, traders utilize the dynamic layering of EMAs to identify trends and momentum shifts, with a cohesive ribbon indicating strength and a divergence signaling potential weakness. Also, embracing these tools equips traders with the expertise needed to analyze the forex market successfully and make well-informed decisions.
If you’re looking for a reliable platform with advanced tools and resources to hone EMA expertise and conquer Forex market, look no further than 4xpip! 4xpip offers a user-friendly interface, comprehensive educational materials, and access to a vibrant community of traders.