In this article, 4xPip sheds light on the significance of the Hockey Stick Chart in the trading landscape. For day traders and swing traders alike, deciphering this chart can unveil potential opportunities for profit. 4xPip’s experts emphasize the importance of keeping a keen eye on the market trends and identifying the hockey stick pattern, especially in fast-paced markets like cryptocurrency and forex.
What Is Hockey Stick Chart?
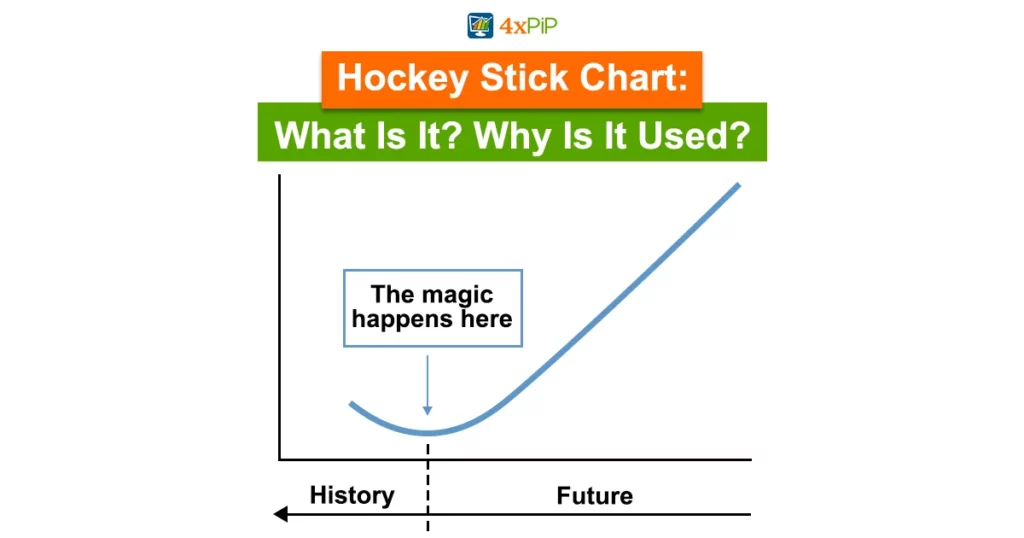
In the dynamic world of trading, understanding various chart patterns is crucial for making informed decisions. Additionally, one such pattern that traders often encounter is the Hockey Stick Chart. This distinctive chart formation is characterized by a sudden and sharp increase in the value of a financial instrument, resembling the shape of a hockey stick. Moreover, as a trader navigating the realms of stocks, cryptocurrency, and forex, recognizing this pattern can be instrumental.
Newcomers to the trading scene will find valuable insights here. 4xPip not only provides in-depth knowledge about the Hockey Stick Chart but also encourages traders to explore the tools and resources available on their website. Whether you are an experienced investor or a novice trader, taking advice from 4xPip’s experts can prove beneficial.
Explore 4xpip for trading tools, like Expert Advisors and Indicators, to enhance your experience. Get valuable resources for auto trading and contact [email protected] for support. In the competitive trading world, knowledge and the right tools matter. Stay informed with 4xPip for insights and automation solutions.
Example of a Hockey Stick Chart:
Start-Up Success Story: Imagine a tech start-up that launches a revolutionary product in the market, such as a groundbreaking app or a cutting-edge device. In the initial phases, the company experiences steady but moderate growth as it establishes its presence.
Product Adoption Phase: As the innovative product gains traction and consumers begin to recognize its value, there comes a pivotal moment. This is where the Hockey Stick Chart comes into play. The adoption rate of the product suddenly spikes, reflecting a sharp increase in sales and user engagement.
Market Recognition: The Hockey Stick Chart in this business example symbolizes the point at which the market fully recognizes and embraces the product. This sudden surge in demand propels the business to new heights, attracting attention from investors, stakeholders, and the media.
Scaling Operations: The company needs to quickly expand to meet market demands, requiring strategic planning for a smooth transition to exponential growth.
Investor Confidence: The Hockey Stick Chart becomes not only a visual representation of the business’s success but also a confidence booster for investors. The significant uptick in performance signals a lucrative opportunity, attracting additional funding and support for further expansion.
Challenges and Risks: While the Hockey Stick Chart signifies success, it also comes with challenges. Managing rapid growth, maintaining product quality, and adapting to market dynamics become crucial considerations for the business during this phase.
Hockey Stick Charts Basics:
Visual Representation: Hockey Stick Charts visually show a sudden increase in a financial instrument’s value or performance, resembling a hockey stick’s shape.
Indication of Growth Acceleration: This chart pattern is indicative of a phase where the growth or value of an asset accelerates rapidly. It’s a crucial signal for traders and investors as it signifies a potential opportunity for profit.
Market Momentum: The Hockey Stick Chart reflects a change in market momentum. This could be triggered by various factors such as positive news, increased demand, or a breakthrough development in the underlying asset.
Timeframe Considerations: Understanding the timeframe of a Hockey Stick Chart is essential. While it visually represents a sudden surge, traders need to analyze whether this is a short-term spike or the beginning of a more sustained uptrend.
Risk and Reward Assessment: When facing a Hockey Stick Chart, traders must weigh risks and rewards. Its sharp upward movement offers profit potential but increases volatility.
Applicability Across Markets: Hockey Stick Charts are not exclusive to a particular market. They can be observed in stocks, cryptocurrency, forex, and other financial instruments. Traders need to adapt their strategies based on the market they are navigating.
Confirmation Through Technical Analysis: Confirming the validity of a Hockey Stick Chart often involves complementary technical analysis tools. Traders may use indicators, trendlines, and other chart patterns to validate the authenticity of the sudden surge in value.
Utilizing Automation in Trading:
In the ever-evolving world of trading, the use of automation tools has emerged as a pivotal factor. 4xPip recognizes the value of incorporating Expert Advisors (EAs) and Indicators into trading strategies, giving traders an advantage in dynamic markets.
Automation in trading offers many advantages, improving efficiency and informed trading. Expert Advisors and Indicators play a vital role in decision-making and risk management.
Efficiency and Precision: EAs and Indicators streamline trading processes, ensuring precise and efficient execution of trades. This saves time and minimizes errors, crucial in the fast-paced financial markets.
Data Analysis and Pattern Recognition: These automated tools excel in data analysis and pattern recognition, providing traders with valuable insights into market trends. The advanced algorithms embedded in EAs and Indicators empower traders to comprehensively analyze market data, aiding in more informed decision-making.
Risk Management: Automation is crucial for effective risk management. EAs execute stop-loss orders and manage trades based on predefined parameters, reducing emotional trading and promoting disciplined risk management.
Compatibility with Trading Platforms: Expert Advisors and Indicators seamlessly integrate with popular trading platforms such as MetaTrader 4 (MT4) and MetaTrader 5 (MT5). This compatibility ensures accessibility for a wide range of traders, regardless of their preferred trading platform.
Customization and Flexibility: Traders can customize EAs and Indicators to align with their specific trading goals and risk tolerance. This level of flexibility allows for a personalized approach to trading while harnessing the benefits of automation.
Summary:
4xPip’s blog emphasizes Hockey Stick Charts in dynamic markets. Explore tools at 4xpip.com, and learn from a real-world business example illustrating chart patterns and automation’s role in trading success. Recognize the efficiency of Expert Advisors (EAs) and Indicators. Stay informed for success in the competitive trading landscape.