Unlock clarity in trading with Heikin-Ashi, developed by Munehisa Homma in the 1700s. This Japanese candlestick charting method minimizes market noise, aiding trend and reversal identification.
Heikin-Ashi: A Noise-Free Perspective:
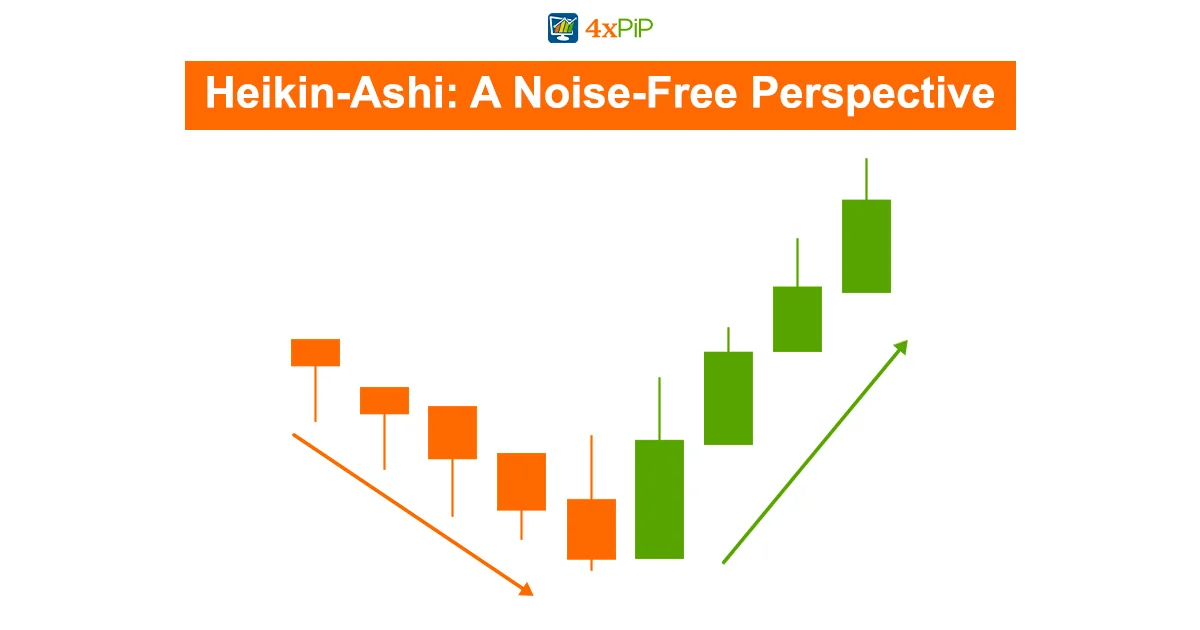
Different from standard candles, Heikin-Ashi’s modified formula uses two-period averages, resulting in a smoother appearance. While it helps spot trends and reversals, it may impact risk assessment by hiding some price data.
Calculating Heikin-Ashi: The Formulas in Action:
Create Heikin-Ashi candles with formulas involving open, high, low, and close. The averaging technique aids trend identification but may pose challenges for day traders seeking quick price moves.
Reading Heikin-Ashi Candles: What to Look For:
Candles with no lower shadows signal a strong uptrend, while no upper shadows indicate a strong downtrend. Reversal candlesticks like traditional patterns, offering insights into trend changes and potential entry points
Heikin-Ashi vs. Renko Charts: Key Differences:
Compare Heikin-Ashi and Renko charts. Heikin-Ashi uses two-period averages, while Renko focuses on movements of a certain size. Understanding these distinctions helps traders choose the right tool for their strategy.
Limitations of Heikin-Ashi: A Quick Overview:
Despite its advantages, Heikin-Ashi has limitations. The use of two-period data may delay trade setup development, making it less responsive for day traders. Averaged data may unclear crucial price information.
Example Using Heikin-Ashi: Practical Insights:
Illustrate Heikin-Ashi’s application in charting to identify trends and buying opportunities. Hollow or green candles with no lower shadows indicate a strong uptrend, while filled or red candles signal a downtrend.
Heikin-Ashi’s Power: A Trader’s Perspective:
For traders navigating market complexities, Heikin-Ashi is a valuable ally. It reduces false signals in sideways markets, enhancing decision-making. Be aware of limitations and adapt strategies accordingly.
Staying in the Trade: Heikin-Ashi Continuity:
Heikin-Ashi guides staying in a trade until a color change signals a potential trend reversal. Interpret color changes wisely, as they could indicate a pause, not necessarily the end of a trend.
Conclusion: Heikin-Ashi Wisdom for Traders:
In conclusion, Heikin-Ashi is a powerful asset for traders seeking clarity. While not perfect for every style, understanding its subtilities improves decision-making. Enhance your trading with 4xPip’s expert support and tools.
Connect with 4xPip’s experts at [email protected] for personalized guidance and information. Explore Heikin-Ashi on our website.
Empower your trading journey with Heikin-Ashi and 4xPip’s expert support.


