In the fast-paced world of Forex trading, staying ahead requires innovative tools. Enter the Ichimoku Kinko Hyo , a game-changer for traders seeking higher probability trades. Developed in 1968 by Goichi Hosoda, this equilibrium chart, commonly known as Ichimoku, has become a staple for both novice and seasoned traders.
Understanding Ichimoku: A Comprehensive Overview:
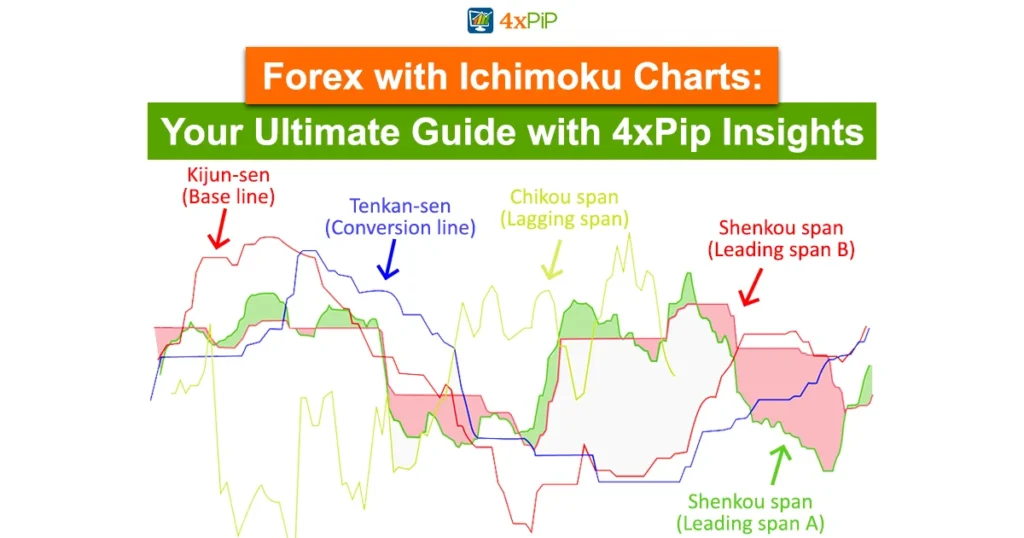
Before diving into trading strategies, let’s unravel the components of the Ichimoku chart. Its complexity may seem daunting, but breaking it down simplifies its application. The chart comprises four main elements: the Tenkan and Kijun Sens lines, the Ichimoku cloud, Senkou Span A, and Senkou Span B. These components work in harmony, offering traders valuable insights into Forex market price action.
Tenkan and Kijun Sens Lines: Unveiling Trends:
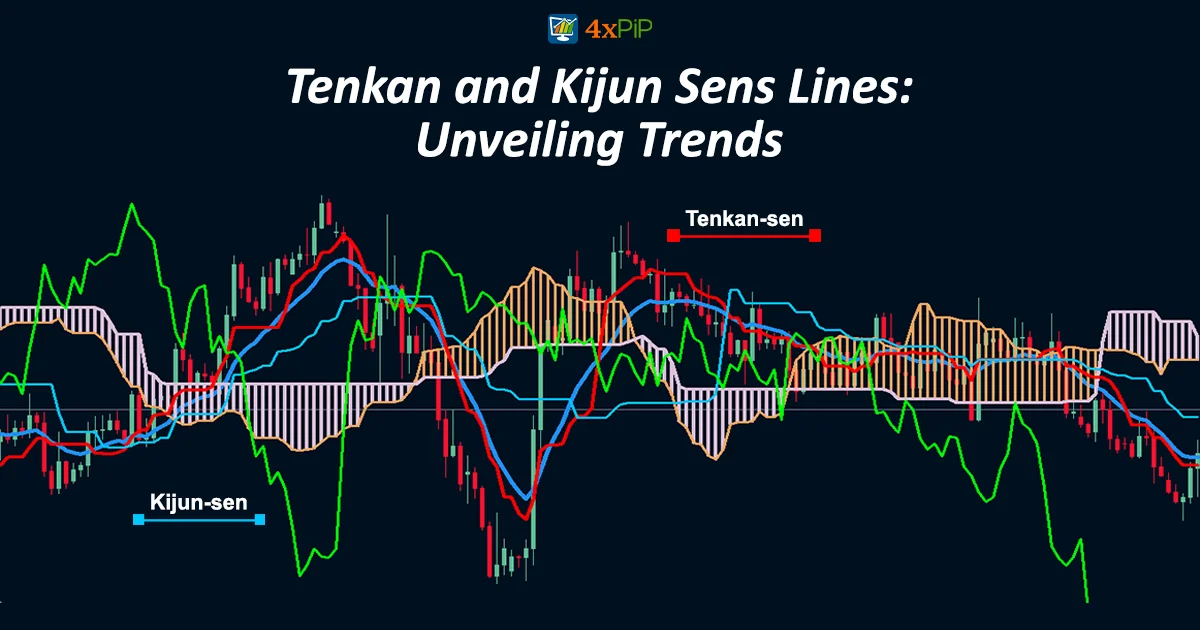
The Tenkan and Kijun Sens lines act as moving average crossovers, signaling shifts in trend and entry points. Calculated over different time periods, these lines provide a dynamic perspective on short-term and long-term price trends. Traders can leverage crossovers for timely decision-making.
Ichimoku Cloud: A Robust Filter for Market Dynamics:
The heart of the Ichimoku lies in its cloud, representing both current and historical price action. Thicker than conventional support and resistance lines, the cloud serves as a powerful filter, accounting for currency market volatility. Breakthroughs or failures to breach the cloud signal potential trading opportunities or risks, guiding traders towards informed decisions.
Senkou Span A and Senkou Span B: Charting Future Movements:
Projected 26 periods ahead, Senkou Span A and Senkou Span B contribute to the Ichimoku cloud’s robustness. These components create a formative barrier, offering a clear visual representation of potential support and resistance levels. Traders can use this information to navigate market dynamics with confidence.
Chikou Span: Decoding Market Sentiment:
The Chikou Span, calculated based on the most recent closing price, acts as a market sentiment indicator. Positioned 26 periods behind the price action, it reflects prevailing trends concerning current price momentum. A Chikou Span below the price trend signals bearish sentiment, while an upward presence suggests a bullish market.
Executing Trades with Ichimoku: A Step-by-Step Guide:
Now that we’ve unraveled the intricacies of Ichimoku, let’s explore its practical application in executing trades. Using a USD/JPY example, we’ll highlight key steps, including the crossover of Tenkan and Kijun lines, confirmation through the Chikou Span, and the significance of the cloud breakthrough.
The Ichimoku Cloud Technique: Turning Analysis into Action:
In the USD/JPY scenario, with a range-bound price fluctuation between 116 and 119 figures, the Ichimoku cloud becomes a vital support and resistance barrier. The Tenkan and Kijun Sen crossovers within the cloud demand careful observation. A clear breakthrough of the cloud signals a potential trade opportunity, emphasizing the importance of sound money management.
Optimal Time Frames for Ichimoku Chart: Tailoring to Your Trading Style:
The effectiveness of the Ichimoku relies on choosing the right time frame. Day traders benefit from shorter periods, up to six hours, while those with a long-term perspective find daily or weekly time frames more suitable. Adapting the Ichimoku to your trading style enhances its reliability and relevance.
Acknowledging Limitations: Drawbacks of the Ichimoku Chart:
While the Ichimoku chart offers a powerful tool for traders, it’s essential to recognize its limitations. As a technical indicator based on historical data, it’s not a guaranteed predictor of future results. Traders should approach it with a level of caution, combining its insights with other analyses for a comprehensive trading strategy.
Reliability of Ichimoku: A Trusted Ally in Trading:
Despite its limitations, the Ichimoku chart has gained recognition for its reliability in equities, futures, and forex trading. Traders appreciate its ability to provide more plotted data points, facilitating well-informed investment decisions. Its widespread use across different markets and periods solidifies its reputation as a trustworthy tool in the trader’s toolkit.
Conclusion:
Integrating Ichimoku charts into your trading strategy opens doors to more informed decision-making. As you embark on your Forex journey, consider the insights shared in this guide. Remember, 4xPip stands as a reliable companion in your trading endeavors. Explore their website for cutting-edge tools, expert advice, and automated trading solutions. Reach out to their dedicated customer support at [email protected] for personalized guidance.
In this ever-evolving financial landscape, mastering tools like the Ichimoku chart positions you for success. Take the plunge, equip yourself with knowledge, and let 4xPip be your guide in navigating the complexities of Forex trading.