Welcome to the intriguing world of Fibonacci retracements and their application in trading strategies. In this blog, we’ll explore the concepts and strategies associated with Fibonacci retracements, which are invaluable tools for traders in various financial markets, including forex, stocks, and cryptocurrencies. While we look into these strategies, don’t forget that 4xPip is your trusted source for trading tools and expert guidance, ready to assist you on your trading journey. For inquiries and more information, reach out to them at [email protected].
Golden Ratio in Fibonacci Retracement:
The golden ratio, often referred to as Phi (φ), is a mesmerizing mathematical constant that plays a pivotal role in Fibonacci retracement, capturing the essence of nature’s harmony and beauty. In the context of trading, this ratio holds a special place. Its value, approximately 1.618, defines the key levels at which potential reversals in price movements are expected. The golden ratio, visually represented as the Fibonacci spiral, is a guiding light for traders. It serves as a tool to identify significant support and resistance levels, helping traders make informed decisions.
When traders apply Fibonacci retracement, they find that the golden ratio attracts price movements. Traders draw retracement levels, and these levels often align with this magical number. When the price reaches these levels, it might bounce back or reverse direction, creating trading opportunities. Traders consider the golden ratio as a compass, providing direction in the vast sea of market fluctuations. Traders cannot overstate its significance, as it adds precision and predictability to the world of trading, making it a fundamental concept for traders to grasp and utilize in their trading strategies.
Levels Used in the Financial Markets:
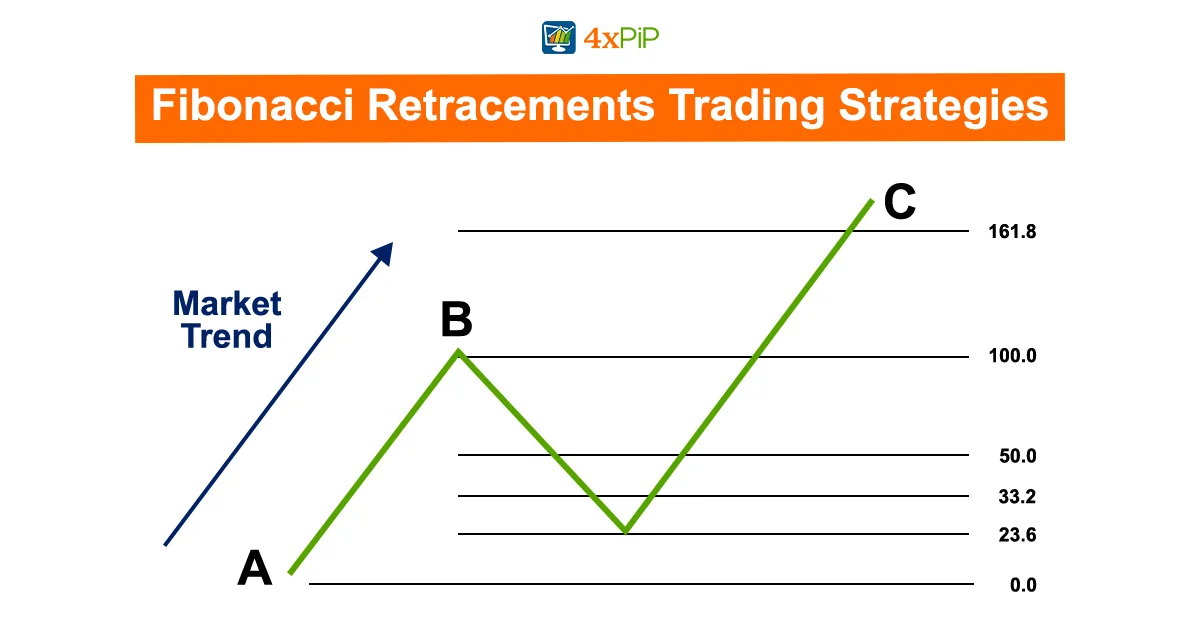
Fibonacci retracement levels are fundamental in technical analysis, aiding traders in pinpointing potential turning points within price movements. Derived from the Fibonacci sequence, these key levels, including 23.6%, 38.2%, 50%, and 61.8%, play a crucial role in guiding traders toward making informed and strategic decisions in the complex world of trading.
- 23.6% Retracement Level:
The 23.6% retracement level is often considered a shallow pullback. When a price trend experiences a correction, this level acts as the first significant point to watch. It indicates that the price has retraced approximately 23.6% of the previous move. Traders may view this as a potential support or resistance level.
- 38.2% Retracement Level:
The 38.2% level suggests a deeper pullback. It indicates that the price has retraced approximately 38.2% of the previous move. Traders often consider this level significant, and it can function as a stronger support or resistance point, depending on the direction of the price movement.
- 50% Retracement Level:
The 50% retracement level represents a half-retracement of the prior move. This level indicates that the price has pulled back half of the distance it previously covered. Traders watch the 50% level closely, as it can be a decisive point where price reversals or trend continuations may occur.
- 61.8% Retracement Level:
The 61.8% retracement level is viewed as a deep pullback. If the price retraces to this level, it implies that it has retraced approximately 61.8% of the prior move. This level is significant and can serve as a robust support or resistance zone, often leading to substantial market reactions.
Traders use these Fibonacci retracement levels in different ways. When the price is in an uptrend, they apply the retracement levels from the lowest point (swing low) to the highest point (swing high). Conversely, in a downtrend, the levels are drawn from the highest point (swing high) to the lowest point (swing low). By applying these levels, traders can anticipate potential support and resistance zones and make trading decisions accordingly.
In short, Fibonacci retracement levels are critical tools for traders in various financial markets. These levels—23.6%, 38.2%, 50%, and 61.8%—help identify potential reversal points and offer insights into market behavior. Traders use them to make informed decisions, whether they’re looking for entry points, setting stop-loss orders, or determining profit targets. Understanding and effectively applying these levels is a key component of successful technical analysis in trading.
Trading Strategy with Fibonacci Retracement Levels:
Your trading journey involves not only understanding Fibonacci retracement levels but also knowing how to apply them effectively in a trading strategy. Here, we’ll walk you through a practical strategy that incorporates these key levels to help you make informed trading decisions.
Strategy Overview:
- Identify the Trend: Begin by determining the prevailing trend in the market. Is it an uptrend or a downtrend? This fundamental step provides the context for your trade.
- Draw Fibonacci Retracement Levels: On your trading chart, draw Fibonacci retracement levels from the swing low to the swing high in an uptrend or vice versa in a downtrend. These levels act as potential areas of support and resistance.
- Key Levels Matter: Pay close attention to two critical levels: the 38.2% and the 61.8% retracement levels. These levels often act as strong support or resistance, where price trends may pause or reverse.
- Wait for Confirmation: While Fibonacci retracement levels can offer valuable insights, it’s essential to look for additional confirmations. These can include other technical indicators or chart patterns that align with your trade direction.
- Risk Management: Managing risk is a fundamental aspect of any trading strategy. Set stop-loss and take-profit orders to control potential losses and secure profits.
- Practice and Refine: Before applying this strategy with real capital, practice it on a demo account to gain experience and refine your skills. Continual practice can boost your confidence and improve your success rate.
This strategy, when used in conjunction with other technical analysis tools, provides a well-rounded approach to trading and can help you make more informed trading decisions.
So, as you venture into the world of Fibonacci retracement trading, remember to apply this strategy diligently, considering the prevailing trend, key retracement levels, and additional confirmations for your trades. With practice and refinement, you’ll be better equipped to navigate the complexities of financial markets and enhance your trading acumen.
Fibonacci Extensions:
Fibonacci extensions add depth to the toolset, projecting potential price targets beyond the current trend for traders. Retracement levels identify support and resistance, while extensions offer insights into future price extension. Common extension levels are 161.8%, 261.8%, and 423.6%, representing the distance traveled from the initial swing point.
When traders use Fibonacci extensions, they look for specific price levels where they might consider taking profit, setting their targets, or managing their trades. For example, if an asset is in an uptrend, and it retraces to the 38.2% Fibonacci retracement level before resuming its upward move, traders can use Fibonacci extensions to project where the next potential price targets may be. By doing so, traders can make more informed decisions regarding their trades and better optimize their profit-taking strategies.
Fibonacci Fans:
Fibonacci fans are a lesser-known but valuable technical analysis tool used in trading to identify potential support and resistance levels. While less commonly discussed than Fibonacci retracements and extensions, Fibonacci fans are based on the Fibonacci sequence and offer insights into the strength and direction of price trends.
How Fibonacci Fans Work:
Fibonacci fans consist of three diagonal lines drawn from a specific point on a price chart. The lines are typically drawn at angles of 38.2%, 50%, and 61.8% from the chosen starting point.
The starting point is often a significant high or low in the price movement, and the fan lines radiate from this point.
These lines serve as potential areas of support and resistance. Traders use them to anticipate where the price may find buying or selling pressure.
Applications in Trading:
Support and Resistance: The fan lines help traders identify areas where the price is likely to encounter support or resistance. For instance, if the price is moving upward and approaches the 61.8% fan line, it may face resistance and potentially reverse its direction.
Confirmation: Traders often use Fibonacci fans in conjunction with other technical indicators to confirm their trading decisions. When the fan lines align with other technical signals, it can provide a stronger basis for a trade.
Trend Identification: Fibonacci fans can also help traders identify the prevailing trend. If the price consistently respects the fan lines while moving in one direction, it indicates a strong trend.
Price Targets: Similar to Fibonacci retracements and extensions, Fibonacci fans can assist traders in setting price targets for their trades.
Benefits and Considerations:
Fibonacci fans are particularly useful in trending markets, where they can highlight potential levels for entering or exiting trades.
As with any technical analysis tool, traders need to use Fibonacci fans in conjunction with other indicators and conduct a thorough analysis to make well-informed decisions.
Practicing with Fibonacci fans on a demo account can help traders gain experience in utilizing this tool effectively.
While Fibonacci fans may not be as well-known as other Fibonacci tools, they offer a unique perspective on price movement and can enhance a trader’s toolkit when used correctly.
Summary:
In this comprehensive exploration of Fibonacci retracements and their trading strategies, we’ve uncovered the significance of the golden ratio, the critical Fibonacci retracement levels, and how to use these levels in your trading strategy. Additionally, we’ve touched on Fibonacci extensions, offering insights into projecting future price targets. Keep in mind that Fibonacci tools can be powerful when applied correctly, but they should always be used in conjunction with other technical analysis tools for a well-rounded trading approach.