In the world of trading, the Heikin-Ashi technique is a powerful tool that uses Japanese candlestick charts to analyze market prices. It was created in the 1700s by Munehisa Homma. This technique helps filter out market noise and gives a clear picture of trends and possible reversals. If you want to enhance your trading, check out 4xPip. We offer advanced tools and expert advice, including the MT4 Heiken Ashi Indicator for better accuracy in MetaTrader. Contact us at [email protected] for personalized support.
Understanding Heikin-Ashi Technique:
Heikin-Ashi is a different way of looking at stock charts. Instead of using the usual open, high, low, and close prices, it uses average prices. This makes the charts smoother and helps to see trends and changes in direction more easily. The formula used in Heikin-Ashi focuses on two-period moving averages, making it stand out from regular candlestick charts. Traders can use these smoother charts to identify trends and make better trading plans.
Heikin-Ashi Formula:
When you look at Heikin-Ashi, you can see that it uses the open-close data from the last period and the OHLC data from the current period to make special candlesticks. This method helps show price changes more simply. By focusing on these changed values, traders can better understand how Heikin-Ashi works.
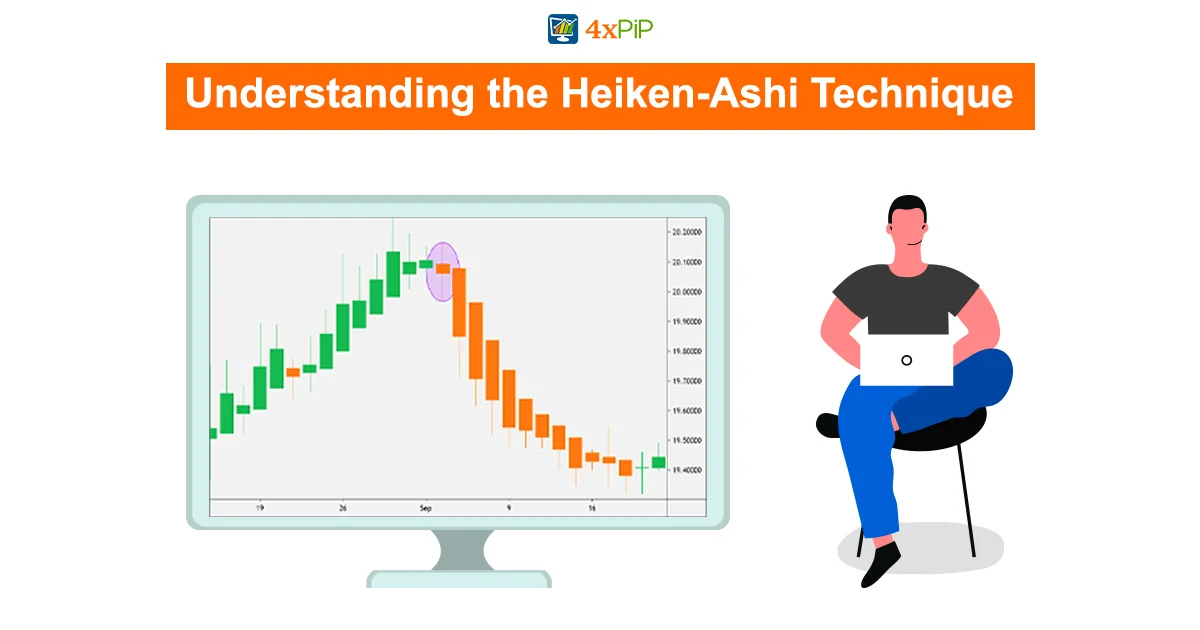
Constructing the Heikin-Ashi Chart:
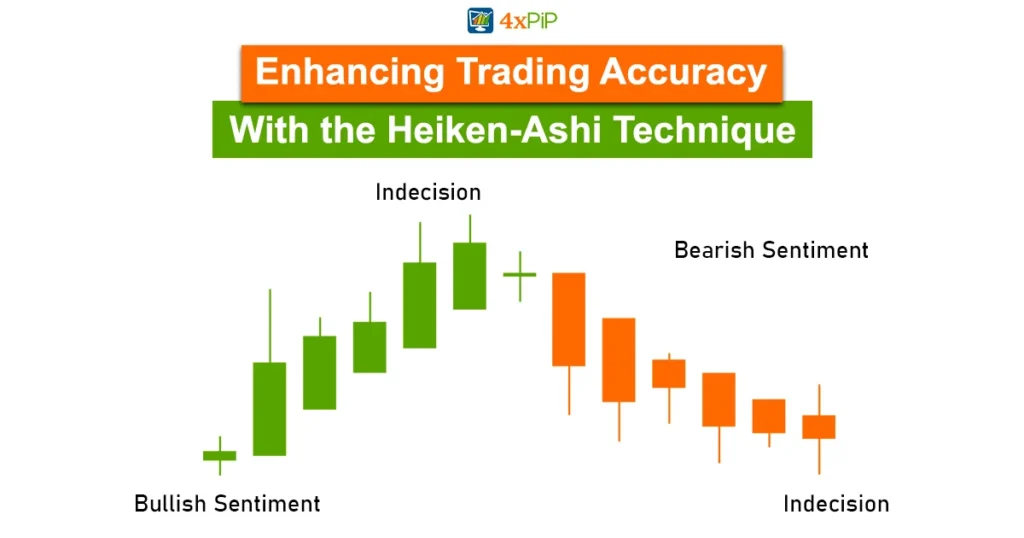
Heikin-Ashi charts look nice because they use red for downward trends and green for upward trends. Unlike regular candlestick charts, Heikin-Ashi makes it easier to see how prices are moving. If you want to try it out, check out the MT4 Heiken Ashi Indicator in MetaTrader.
Heikin-Ashi Indicator Signals:
Heikin-Ashi is a helpful tool for understanding market trends. It gives signals that show how strong a trend is and when it might change direction. Traders use these signals to make better decisions in the financial markets.
Trend Strength:
Understanding trends is crucial when using Heikin-Ashi signals. If you see a series of green or red candlesticks, it means there’s a strong trend. It’s a sign for traders to stick with the trend for better profits. To make this strategy even better, traders can use the MT4 Heiken Ashi Indicator on the MetaTrader platform. It makes their analysis smoother and more effective.
Trend Reversal:
Helping traders predict trend changes is crucial. Heikin-Ashi signals, like doji candlesticks and wedge patterns, are essential for this.
Heikin-Ashi Strategies:
Traders using Heikin-Ashi can boost profits by spotting strong trends, noticing certain candlestick patterns, and understanding small-bodied candlesticks. These strategies help make smarter decisions.
The Emergence of a Strong Bullish or Bearish Trend:
The Heikin-Ashi strategy helps traders reliably spot strong trends. By using this technique, traders can smartly improve their positions when new trends are happening.
Identify Candlesticks with No Shadows:
Identifying candles without shadows is a strong signal of upcoming trends. Traders can use the MT4 Heiken Ashi Indicator to make accurate decisions on when to enter or exit trades. This heading helps traders understand the benefits of using this indicator for better accuracy.
Candlesticks with Small Bodies Indicate Trend Pauses or Reversals:
Small candlesticks can show when a trend might stop or change direction. Traders should check out the MT4 Heiken Ashi Indicator on the MetaTrader platform to make smarter trading choices.
Benefits and Limitations of the Heikin-Ashi Technique:
Traders need to check out the pros and cons of using the Heikin-Ashi technique. This method is easy to use, makes charts clear, and helps reduce noise in trading.
Benefits:
Heikin-Ashi is easy to use and its charts are easy to read, making it a reliable tool for filtering out noise. Traders using MetaTrader can easily find the MT4 Heiken Ashi Indicator to add to their toolkit and align with their trading goals.
Limitations:
Recognizing Heikin-Ashi’s drawbacks, like depending on past prices and not handling gaps, helps traders make smarter choices. To tackle these issues, the blog suggests checking out the various tools in MetaTrader, with the MT4 Heiken Ashi Indicator standing out.
Summary:
The Heikin-Ashi technique, developed by Munehisa Homma in the 1700s, utilizes Japanese candlestick charts with average prices to filter market noise and provide a clear view of trends and potential reversals. This method, explained in detail by 4xPip, employs the MT4 Heiken Ashi Indicator for enhanced accuracy in MetaTrader. The Heikin-Ashi approach involves unique candlestick construction, signals for trend strength and reversals, and various strategies for traders to identify and capitalize on market trends. For personalized help, email our experts at [email protected].