If you’re a trader or investor in the financial markets, you’ve likely come across candlestick charts. Within these charts, you may have encountered a specific candlestick pattern called the Doji. But what exactly is a Doji candlestick, and what are its different types? In this article by 4xPip, we will explain the various kinds of Doji candlestick patterns and help you understand their significance in trading decisions. Tailored for beginners and seasoned professionals, 4xPip empowers traders with insights and capabilities necessary to thrive in the competitive realm of financial markets. Let’s dive into the world of Doji candlestick patterns with 4xPip and discover which one is right for you.
What is The Doji Candlestick Pattern in Forex Trading?
The term “doji” originates from the Japanese word meaning “the same thing,” highlighting the pattern’s characteristic feature where both the open and closed prices are identical. A Doji candlestick pattern or doji star is formed when an asset or security’s opening and closing prices are very close or similar, resulting in a small or nonexistent body. This pattern suggests indecision in the market as neither the buyers nor the sellers have gained control. However, the Doji pattern has several variations, each with its unique characteristics and implications. It represents a tug-of-war between market participants, where neither side has a clear advantage. This indecision often occurs at critical support or resistance levels, which makes it even more significant.
Types of Doji Candlestick Pattern:
Within the realm of Doji candlestick patterns, there are several variations that traders should be aware of. Each type has its formation and implications, providing valuable insights into market sentiment and potential future price movements. Let’s explore some of the most common types of Doji patterns:
-
Standard Doji:
The standard Doji is the most basic form of this candlestick pattern. It occurs when the opening and closing prices are identical, resulting in a cross-like shape. The length of the upper and lower shadows can vary, but they should be relatively long compared to the body.
The standard Doji suggests a state of complete indecision in the market. It indicates that neither the buyers nor the sellers could gain control during the trading session. Traders often interpret this pattern as a potential reversal signal, especially at critical support or resistance levels.
-
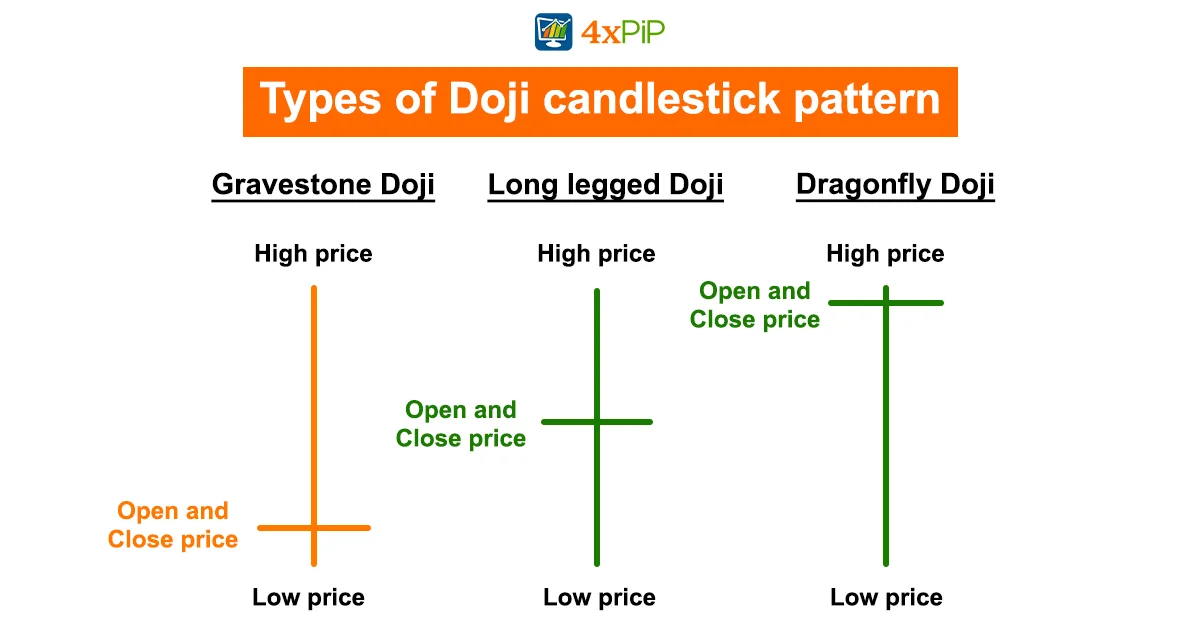
Long-Legged Doji:
Long upper and lower shadows characterize the long-legged Doji, indicating significant price volatility during the trading session. This pattern suggests a higher level of indecision compared to the standard Doji.
Traders pay close attention to the long-legged Doji as it often precedes significant market movements. It indicates that the balance between buyers and sellers is shifting, and a breakout or reversal may be imminent.
-
Dragonfly Doji:
The dragonfly Doji is a bullish reversal pattern that forms when the opening and closing prices are at or near the trading session’s high. It is characterized by a long lower shadow and little to no upper shadow, resembling a dragonfly.
This pattern suggests that sellers were initially in control but lost momentum, allowing buyers to push the price back up. The dragonfly Doji often appears at the bottom of a downtrend, indicating a potential trend reversal. Traders validate the reversal by looking for confirmation signals, such as a bullish engulfing pattern or increased trading volume.
-
Gravestone Doji:
The gravestone Doji is the opposite of the dragonfly Doji and is a bearish reversal pattern. It forms when the opening and closing prices are at or near the low of the trading session. The gravestone Doji is characterized by a long upper shadow and little to no lower shadow, resembling a gravestone.
This pattern suggests buyers were initially in control but lost momentum, allowing sellers to reverse the price. The gravestone Doji often appears at the top of an uptrend, indicating a potential trend reversal. Traders look for confirmation signals, such as a bearish engulfing pattern or a decrease in trading volume, to validate the reversal.
How to Read a Doji Candlestick Pattern?
Each candlestick pattern is defined in part by four kinds of data. Analysts can infer market trends and price movements from this type of data. Every candlestick has an open, high, low, and close as its basis. It doesn’t matter what the period or tick interval is. The body is the filled or hollow bar that the candlestick design creates. Shadows are the lines that project from the body. A hollow candlestick indicates that the stock closed higher than it opened. The body of the candlestick will be filled if the stock closes lower. The Doji is one of the most significant candlestick formations.
An almost identical open and close for a stock is called a doji (which can have both singular and plural versions). Doji typically have tiny or nonexistent bodies and resemble crosses or plus signs. As seen through the lens of auction theory, Doji stands for both buyer and seller uncertainty. There is no price movement because everyone is evenly matched; buyers and sellers are at a standstill.
This is taken as a price reversal signal by some analysts. It might also be the moment when buyers or sellers gather steam to carry on a trend. Doji is frequently observed during consolidation and can be used by analysts to spot possible breakouts in the market.
How to Trade With The Doji Candlestick Pattern?
Trading the different Doji candlestick patterns can be done in various ways. To execute higher probability trades, traders should, however, constantly seek signs supporting what the Doji candlestick indicates. Furthermore, to minimize losses if a trade does not turn out well, it is essential to use good risk management when trading the Doji.
The several Doji Candlestick trading strategies are discussed below.
Doji Candlestick Patterns In Bullish Markets:
Interpreting Doji candlestick patterns requires understanding the broader market context and the specific pattern’s characteristics. In bullish markets, Doji patterns often signal a pause in the upward trend rather than a complete reversal. They indicate buyers are taking a breather, allowing sellers to lower prices. Traders view these patterns as opportunities to buy at a lower price before the uptrend resumes.
On the other hand, in bearish markets, Doji patterns can indicate a temporary pause in the downward trend. They suggest sellers are losing momentum, allowing buyers to push prices slightly higher. Traders may interpret these patterns as potential buying opportunities or signs of a trend reversal.
Doji Candlestick Patterns In Bearish Markets:
Traders commonly use Doji candlestick patterns to identify potential reversal signals. When a Doji appears after a prolonged trend, it suggests that the balance of power is shifting, and a reversal may be on the horizon.
Traders often look for confirmation from other technical indicators or chart patterns to validate a reversal signal. For example, a bullish engulfing pattern following a Doji in a downtrend can provide more decisive bullish confirmation. Similarly, a bearish engulfing pattern following a Doji in an uptrend can provide stronger bearish confirmation.
Doji Candlestick Patterns as Reversal Signals:
Traders incorporate Doji candlestick patterns into their trading strategies in various ways. Some traders use them as standalone signals, while others combine them with other indicators to increase their effectiveness. Here are a few common ways traders use Doji patterns in their strategies:
- Confirmation signals: Traders wait for confirmation signals, such as a break above the high or below the low of the Doji, before entering a trade. This approach helps filter out false signals and increases the probability of successful trades.
- Pattern recognition: Traders look for patterns involving Doji candlesticks, such as the morning star or evening star patterns. These patterns provide additional confirmation of potential reversals or continuations.
- Support and resistance levels: Traders pay close attention to Doji patterns near key support or resistance levels. The interaction between the Doji and these levels can provide valuable insights into market sentiment and potential price movements.
4xPip‘s expert advisors and indicators are highly customizable, allowing you to adjust various settings and parameters to align with your trading strategy and preferences. From timeframes to entry and exit rules, you have the flexibility to tailor these tools to suit your unique approach to trading.
Limitations of Doji Candlestick Pattern:
A doji candlestick is a neutral indication that doesn’t reveal much.
- A Doji is not a dependable indicator for identifying events like price reversals because it is rare.
- Like any technical indicator, Doji patterns may provide false signals, especially in choppy or consolidating markets.
- The significance of isolated Doji patterns depends on the broader market context, requiring traders to consider the overall landscape.
Conclusion:
The Doji candlestick pattern emerges as a pivotal tool for traders, elucidated by 4xPip in their comprehensive article. Offering insights into various Doji types, including the standard, long-legged, dragonfly, and gravestone, the article caters to both novice and experienced traders, emphasizing the significance of understanding market indecision and potential reversals. While highlighting the versatility of Doji patterns in bullish and bearish markets, urging traders to consider the broader market context and employ risk management. 4xPip’s commitment to empowering traders through expert advisors and indicators underscores the importance of informed decision-making. Ultimately, in the dynamic realm of financial markets, where uncertainty prevails, the Doji pattern stands as a valuable ally, aiding traders in decoding market dynamics and making judicious decisions for potential success.


