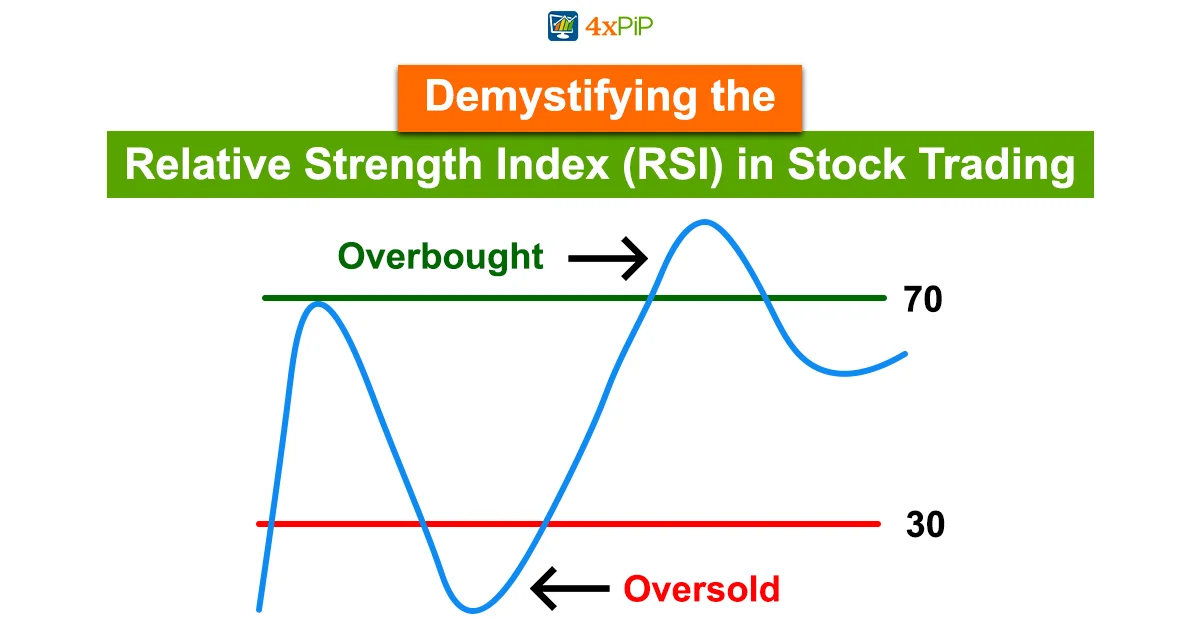
In the dynamic realm of stock trading, understanding indicators is crucial. One such tool, the Relative Strength Index (RSI), introduced in 1978 by J. Welles Wilder Jr., holds significant importance. At 4xPip, we aim to provide comprehensive insights for traders at every level.
Understanding the RSI Indicator:
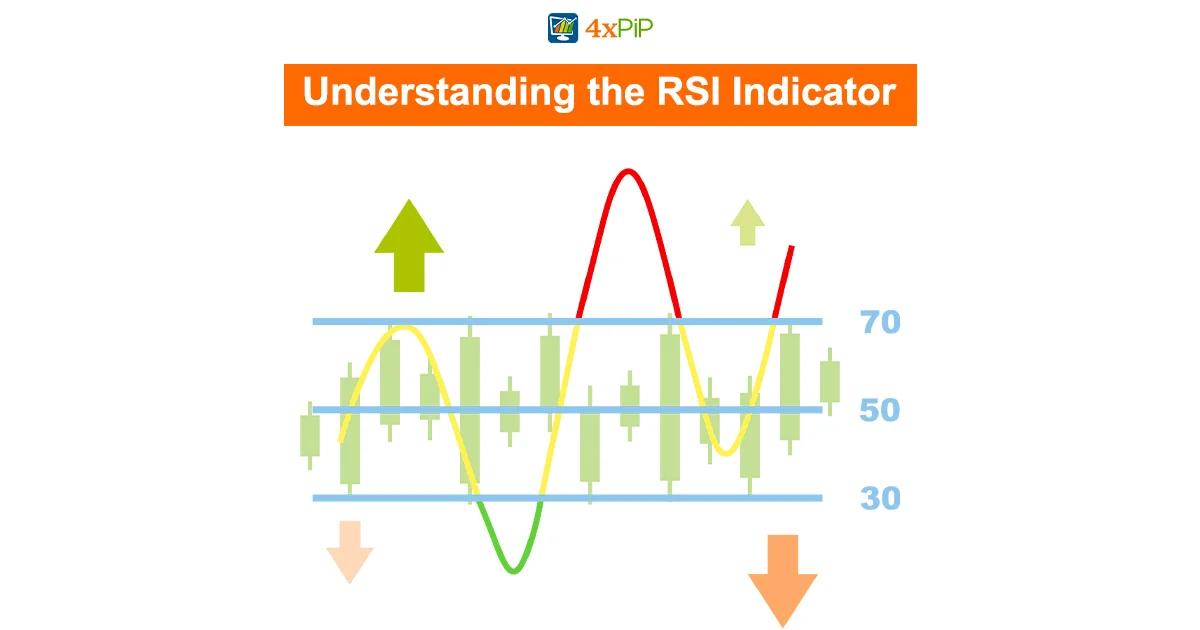
The Relative Strength Index (RSI) serves as a momentum indicator, evaluating the recent speed and magnitude of a security’s price changes. Traditionally, an RSI above 70 suggests overbought situations, while below 30 indicates oversold conditions. However, its utility extends beyond these basic readings.
How the RSI Works:
Calculating the RSI involves a two-part formula. The initial step computes the average gain and loss during a look-back period, usually 14 days. The subsequent calculation smoothens the results to prevent extreme readings in strongly trending markets. Plotting the RSI beneath the asset’s price chart provides a visual representation.
Calculating RSI Divergence for Stop Loss and Take Profit:
In addition to its traditional applications, traders can leverage RSI divergences to set effective stop-loss and take-profit levels. RSI divergence occurs when the price moves opposite to the RSI, offering a potential leading indicator for price changes.
A bullish RSI divergence happens when the RSI displays an oversold reading followed by a higher low, while the price forms lower lows. This signal rising bullish momentum, and a break above oversold territory could be used to trigger a new long position. For traders, setting a stop-loss just below the entry point and a take-profit at a logical resistance level can enhance risk management.
Conversely, a bearish RSI divergence occurs when the RSI creates an overbought reading followed by a lower high, while the price forms higher highs. This suggests potential bearish momentum, and traders might consider setting a stop-loss just above the entry point and a take-profit at a key support level.
Why RSI is Important:
Traders leverage RSI for various purposes, from predicting price behavior to validating trends and identifying overbought or oversold securities. It acts as a valuable tool for short-term traders, offering buy and sell signals and supporting comprehensive trading strategies.
Using RSI with Trends:
Understanding the primary trend is crucial when interpreting RSI readings. In trending markets, traders modify RSI levels to align with the prevailing trend, avoiding false signals. A horizontal trendline between 30 and 70 levels aids in identifying overall trend strength and extremes.
Interpreting RSI and RSI Ranges:
RSI readings during trends often fall into specific ranges. For instance, during an uptrend, RSI tends to stay above 30 and frequently hits 70. Observing deviations from these patterns can signal potential reversals, providing valuable insights for traders.
Example of RSI Divergences for Stop Loss and Take Profit:
To further illustrate the practical applications of RSI divergences, consider incorporating them into your stop-loss and take-profit strategies. A bullish RSI divergence, signaling potential upward momentum, can guide traders in placing strategic stop-loss and take-profit levels for optimal risk management.
For a bearish RSI divergence, where the RSI indicates potential downward momentum, traders can adjust their stop-loss and take profit positions accordingly. By aligning these levels with key support and resistance zones, traders enhance their ability to navigate market fluctuations.
Example of Positive-Negative RSI Reversals:
Positive and negative RSI reversals offer additional insights. A positive reversal occurs when the RSI reaches a low lower than its previous low, coinciding with a security’s higher low—considered a bullish sign and a buy signal. Conversely, a negative reversal indicates a potential bearish scenario.
Example of RSI Swing Rejections:
RSI swing rejections, bullish or bearish, provide signals when the indicator reemerges from overbought or oversold territory. Understanding the four-part process can aid traders in making informed decisions aligned with market trends.
The Difference Between RSI and MACD:
While both RSI and MACD measure asset momentum, they focus on different aspects. RSI gauges price change momentum, while MACD evaluates the relationship between two moving averages. Traders often use them together for a more comprehensive technical analysis.
Limitations of the RSI:
Despite its effectiveness, the RSI has limitations. It’s most reliable in oscillating markets, and true reversal signals are rare. Traders must navigate false alarms, considering that momentum can keep the RSI overbought or oversold for extended periods in strongly trending markets.
Conclusion:
In conclusion, mastering the Relative Strength Index empowers traders with a valuable tool for navigating the complexities of stock trading. At 4xPip, we encourage traders to explore the nuanced applications of the RSI, offering a deeper understanding of market dynamics. For more information and guidance, contact our experts at [email protected]. Explore our range of trading tools and robots for auto trading on our website.

