Candlestick charts are an essential tool in trading, offering a visual representation of price movements and patterns over a specific time frame. Imagine staring at a stock chart riddled with confusing lines and squiggles. Overwhelmed? You’re not alone. That’s where candlestick charts come in, bringing clarity and simplicity to the often chaotic trading world. Understanding the basics of candlestick chart patterns is crucial for beginners entering the exciting world of trading. In this article with 4xPip, we will explore five fundamental candlestick patterns that every beginning trader should be familiar with.
What is the Candlestick Chart in Trading?
Developed in Japan in the 18th century, candlestick charts have become widely popular in modern trading because they provide insightful information at a glance. Think of each candlestick as a tiny story summarizing the price movement of a security over a specific period (like a day, week, or month). These colorful bars pack a punch of information, revealing the opening and closing prices and the highs and lows reached during that period. Analyzing a monthly candlestick chart, where each candle corresponds to a day, reveals a prolonged price decline when consecutive red candles are observed. The vertical lines extending above and below the candle body, commonly known as wicks or shadows, serve as visual indicators for the stock’s highest and lowest traded prices.
What are the Components of a Candlestick?

Each candlestick on the chart is composed of a rectangular “body” and two thin “wicks” (or shadows) extending above and below. The body represents the range between the open and closed prices:
- Filled body (red or black): Close is lower than open, indicating a price decrease (bearish).
- Hollow body (green or white): Close is higher than open, showing a price increase (bullish).
The wicks represent the highest and lowest prices reached during the period, regardless of whether they occurred at the open or close. Long wicks indicate significant volatility, while short wicks suggest a more stable price movement.
Candlestick Chart offers a more comprehensive picture compared to traditional bar charts by incorporating four key data points:
- Open: The price at which the security or asset was first traded during the period.
- High: The highest price reached during the period.
- Low: The lowest price achieved during the period.
- Close: The price at which the security last traded during the period.
Basic Candlestick Charts Patterns for Beginners:
But how do you decode these stories? Let’s break down the five basic candlestick patterns every beginner should know.
Bullish and Bearish engulfing Candlestick pattern:
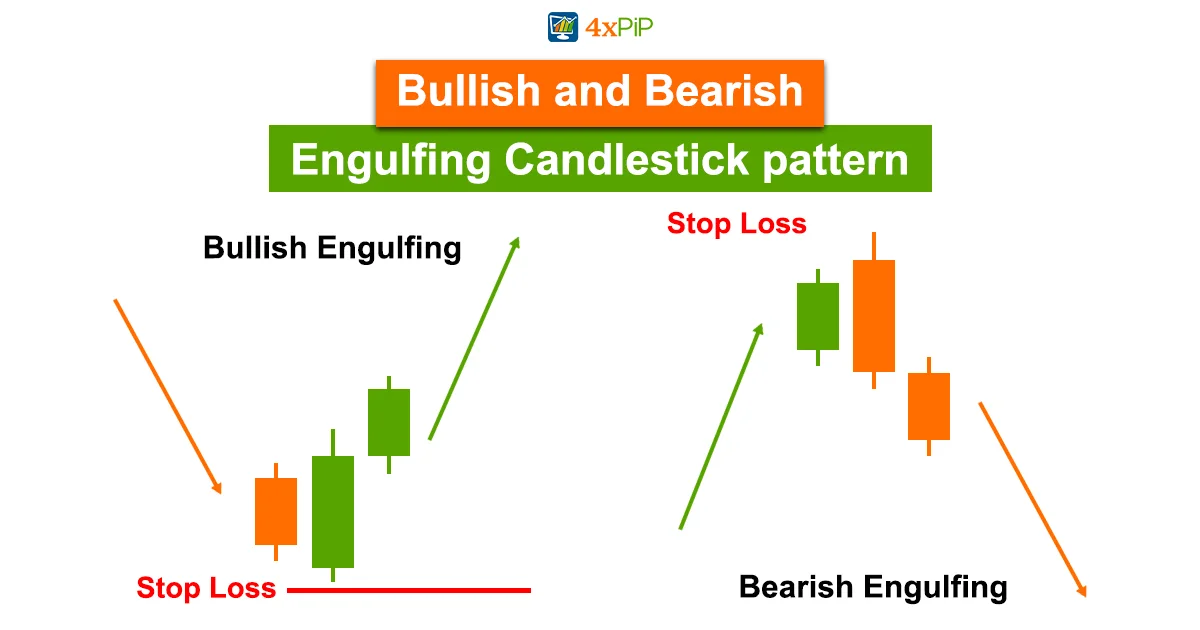
A strong trend reversal pattern where a large candlestick completely engulfs a smaller candlestick of the opposite color is engulfing the Candlestick pattern. It may be bullish or bearish, engulfing a Candlestick pattern.
Bullish engulfing Candlestick pattern:
- The large green candle signifies intense buying pressure pushing the price back up after a decline.
- The complete engulfing of the red candle emphasizes the dominance of the bulls.
- This pattern suggests a potential trend reversal to the upside.
Bearish engulfing Candlestick pattern:
- The large red candle signifies intense selling pressure pushing the price down after an increase.
- The complete engulfing of the green candle emphasizes the dominance of the bears.
- This pattern suggests a potential trend reversal to the downside.
Bullish and Bearish Harami Candlestick Pattern:
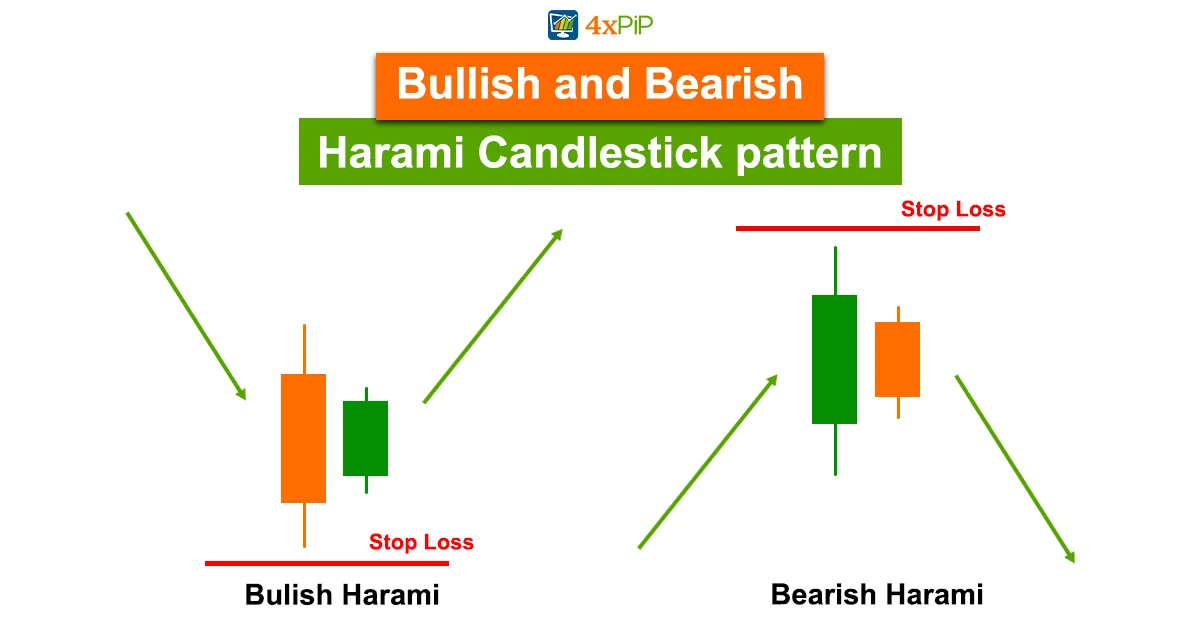
The Harami Candlestick pattern is a reversal pattern in technical analysis consisting of two candles. It indicates a potential shift in market sentiment and a reversal of the prevailing trend. There are two types:
- Bullish Harami (occurs in a downtrend)
- Bearish Harami (occurs in an uptrend)
The smaller second candle suggests indecision in the market. The size of the candles and the overall market context are essential factors in interpreting the reliability of the Harami pattern.
Morning Star and Evening Star Candlestick pattern:
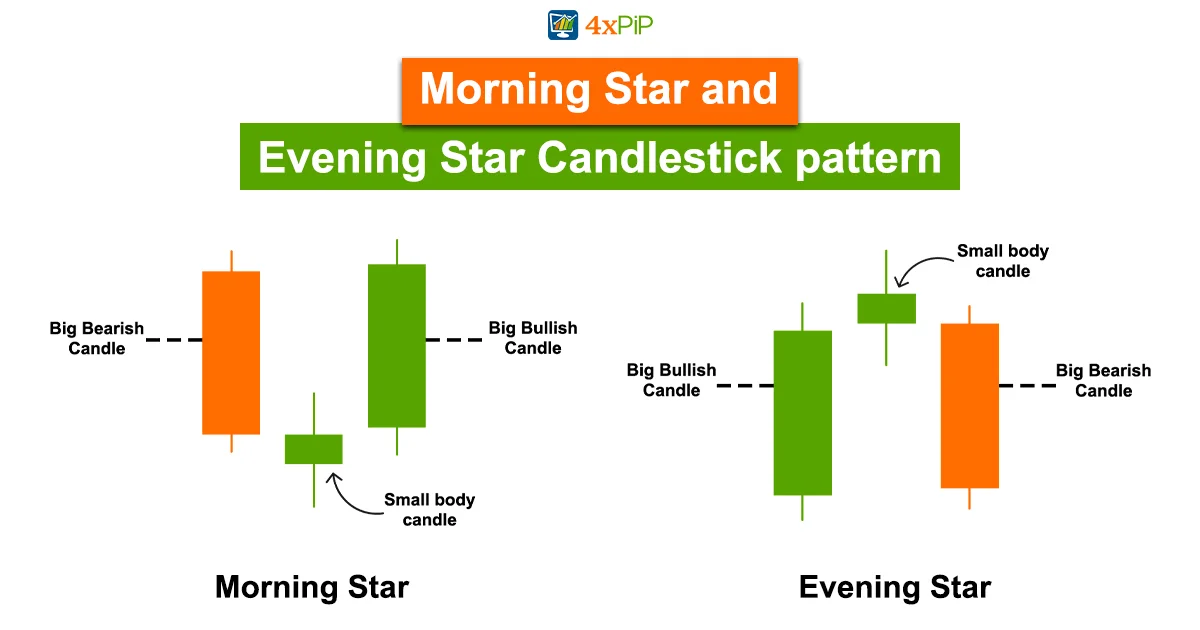
The Morning and Evening Star are three-candlestick patterns used in technical analysis to indicate potential trend reversals.
- The Morning Star signals a shift from a downtrend to an uptrend, featuring a large bearish candle, a small indecisive candle, and a large bullish candle.
- The Evening Star signals a shift from an uptrend to a downtrend, with a large bullish candle, a small indecisive candle, and a large bearish candle.
Traders often use these patterns as signals for potential entry or exit points. The size of the candles and the context of the preceding trend are crucial factors in evaluating the strength of the signal.
Doji Candlestick pattern:
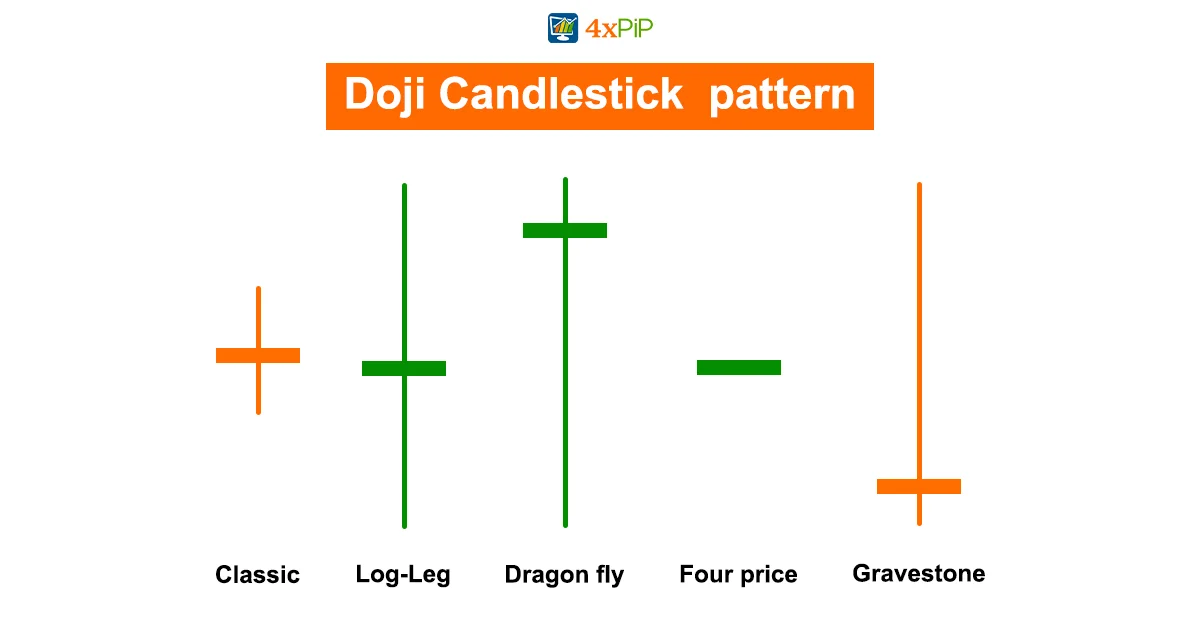
This one’s like a seesaw stuck in the middle. The candlestick’s body is almost non-existent, with the opening and closing prices nearly identical. A Doji suggests indecision in the market, with neither bulls nor bears taking control. Dojis and long-legged dogs have the potential to form at market tops or bottoms, dragonflies typically emerge at market bottoms, and gravestones tend to appear at market tops.
Hammer Candlestick Pattern:
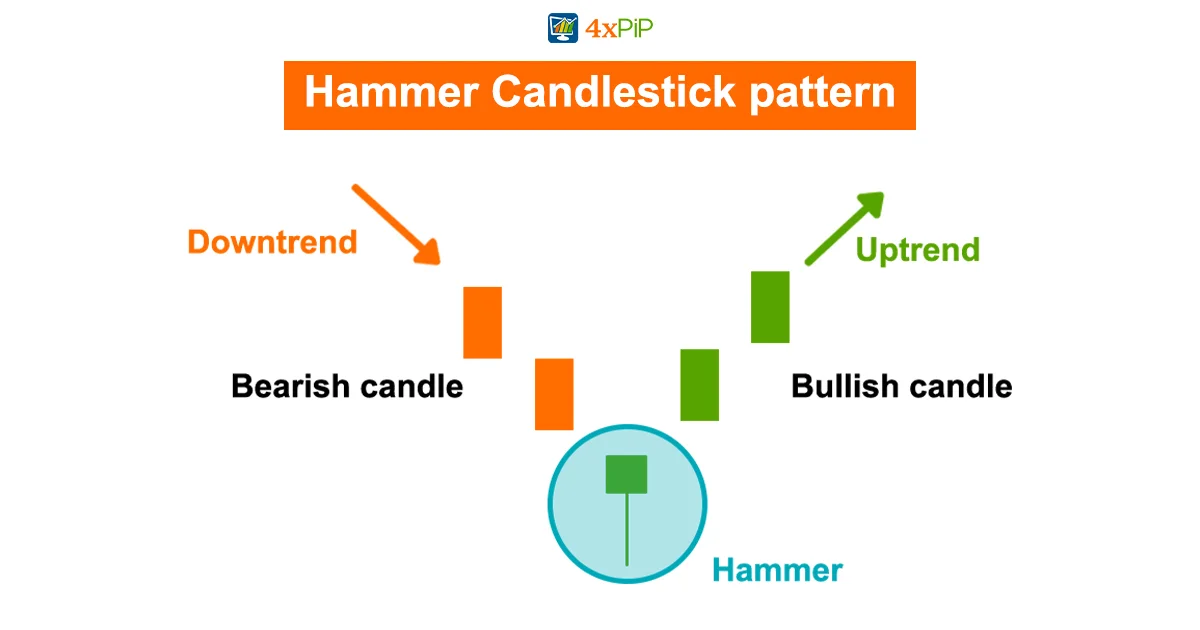
The Hammer Candlestick pattern is a single-candle formation indicating potential trend reversals, often observed after a downtrend.
- It features a small body near the top and a long lower shadow, symbolizing a shift from seller dominance to buyer activity.
- This pattern serves as a bullish reversal signal, suggesting the possibility of a trend reversal from bearish to bullish.
- The Inverted Hammer is a related pattern with a small body at the bottom and a long upper shadow, signaling a potential bullish reversal.
What Candlestick Pattern Is Most Accurate?
In Forex trading, traders employ various candlestick patterns, and among the most accurate are the evening star and morning star patterns, indicating potential trend reversals. Additionally, other reliable patterns include the hammer and inverted hammer, the engulfing pattern, and the harami pattern.
Remember, successful trading goes beyond just patterns. 4xPip provides the tools and support to help you develop a comprehensive trading strategy, manage risk effectively, and confidently make informed decisions. So, start your trading journey with the power of candlesticks and unlock the potential of 4xPip – your gateway to a more informed and profitable trading experience.
Conclusion:
Candlestick charts offer a visual, informative way to track price movements in trading. Understanding basic patterns like engulfing, Harami, Morning/Evening Star, Doji, and Hammer empowers beginners to decode market sentiment and potential trend reversals. While these patterns provide valuable insights, successful trading requires a comprehensive strategy, risk management, and a platform like 4xPip for support and automation. Embrace the power of candlesticks and unlock your trading potential with 4xPip!


